The Challenge
Existing dashboard reporting was completed from within Concentrix. The internal business analyst had to create and file requests with developers for every new view, leading to delays. We needed a builder that was: simple enough for first-time users, robust enough for client analysts, consistent with our new design system, and performant with hundreds of widgets and data sources so users could have the freedom to choose what story they wanted the data to tell.
My Role
Led UX design: from requirement gathering, wireframes, prototyping, interaction design, and user testing. Collaborated with product manager, data engineers and front‐end developers to ensure feasibility. Defined design system components that could be reused (widget containers, charts, filters).
Process & Approach
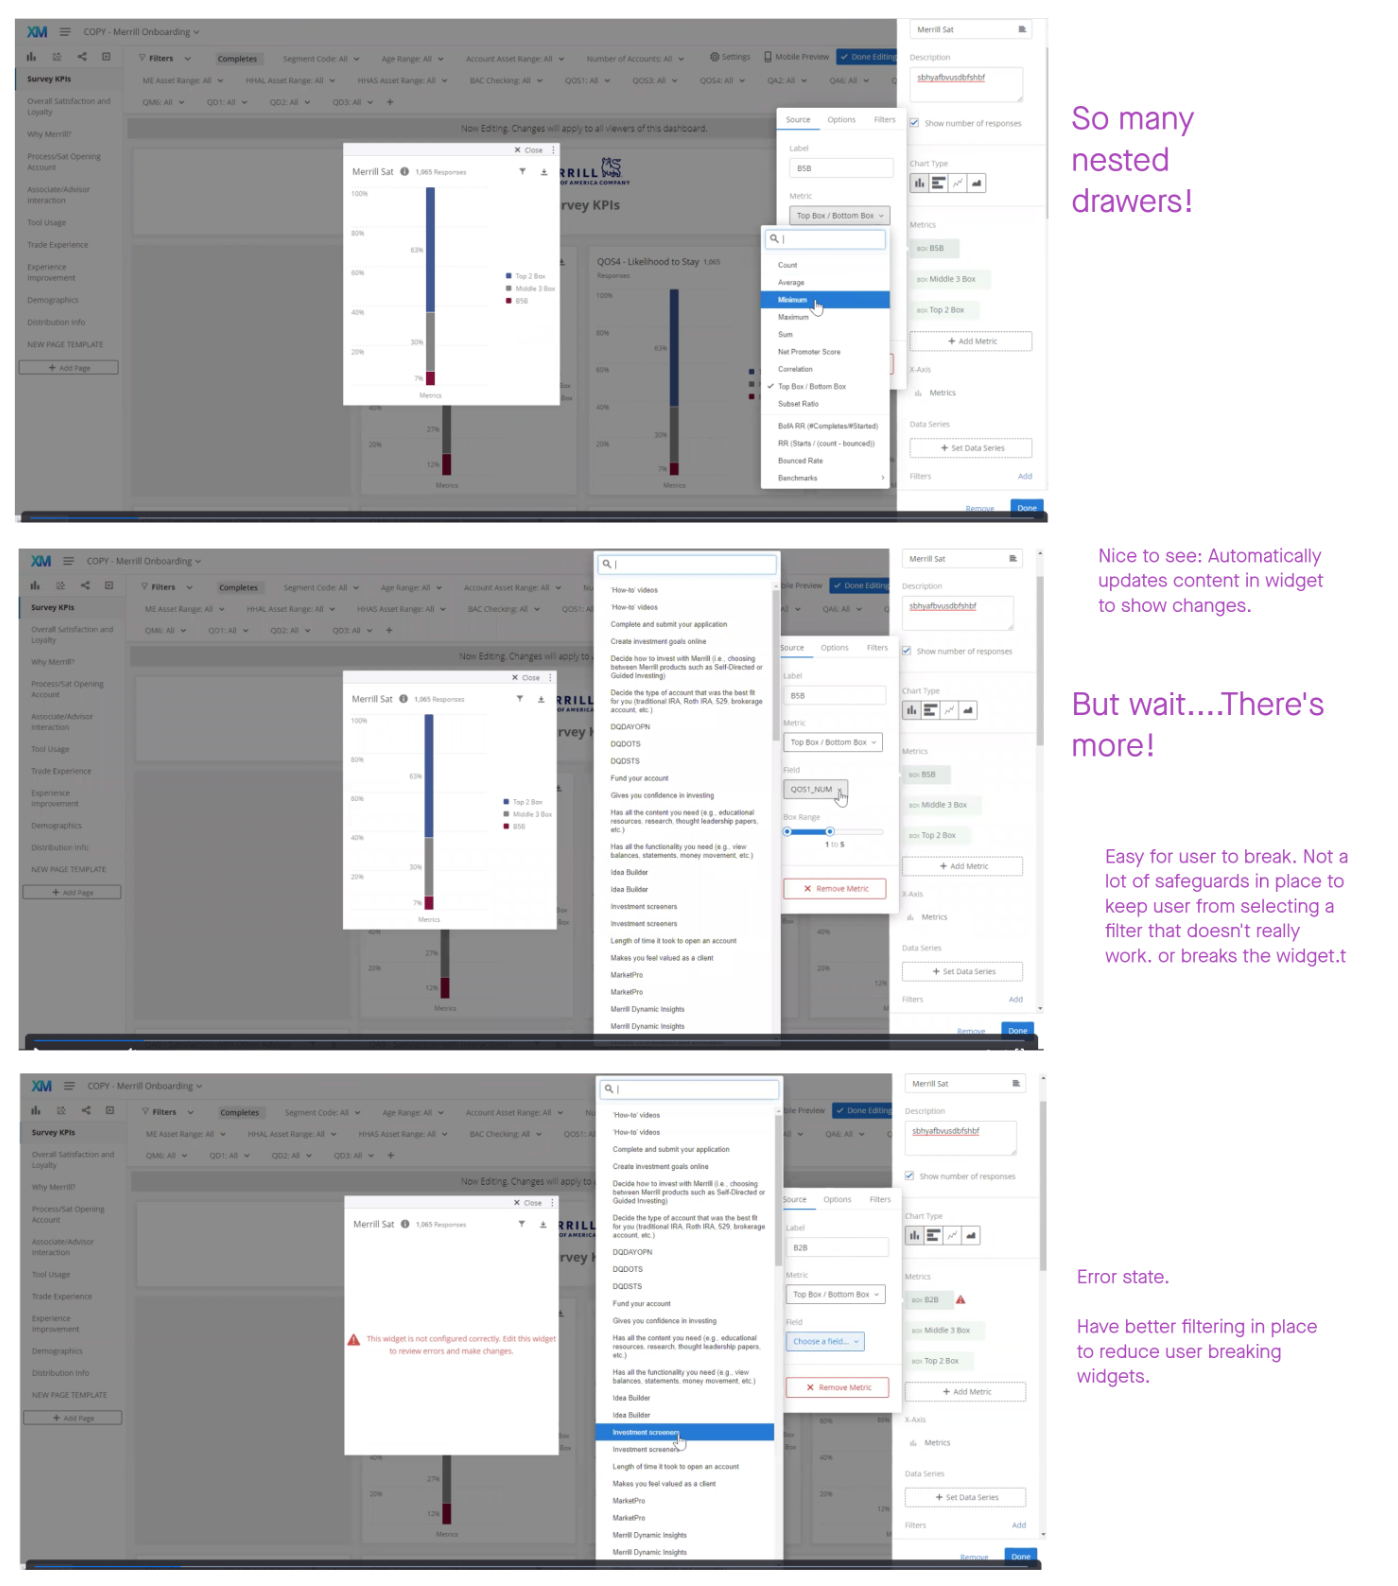
Discovery/Research: Conducted stakeholder interviews to understand business goals. Conducted user interviews to understand pain points and 'wish list.' Also completed a competitive analysis of existing leading dashboard tools. Had an insider demo a competitor product similar to what we would want to build. Investigated how Qualtircs (primary competitor) handled certain complicated user flows and saw real pain points from their customers.
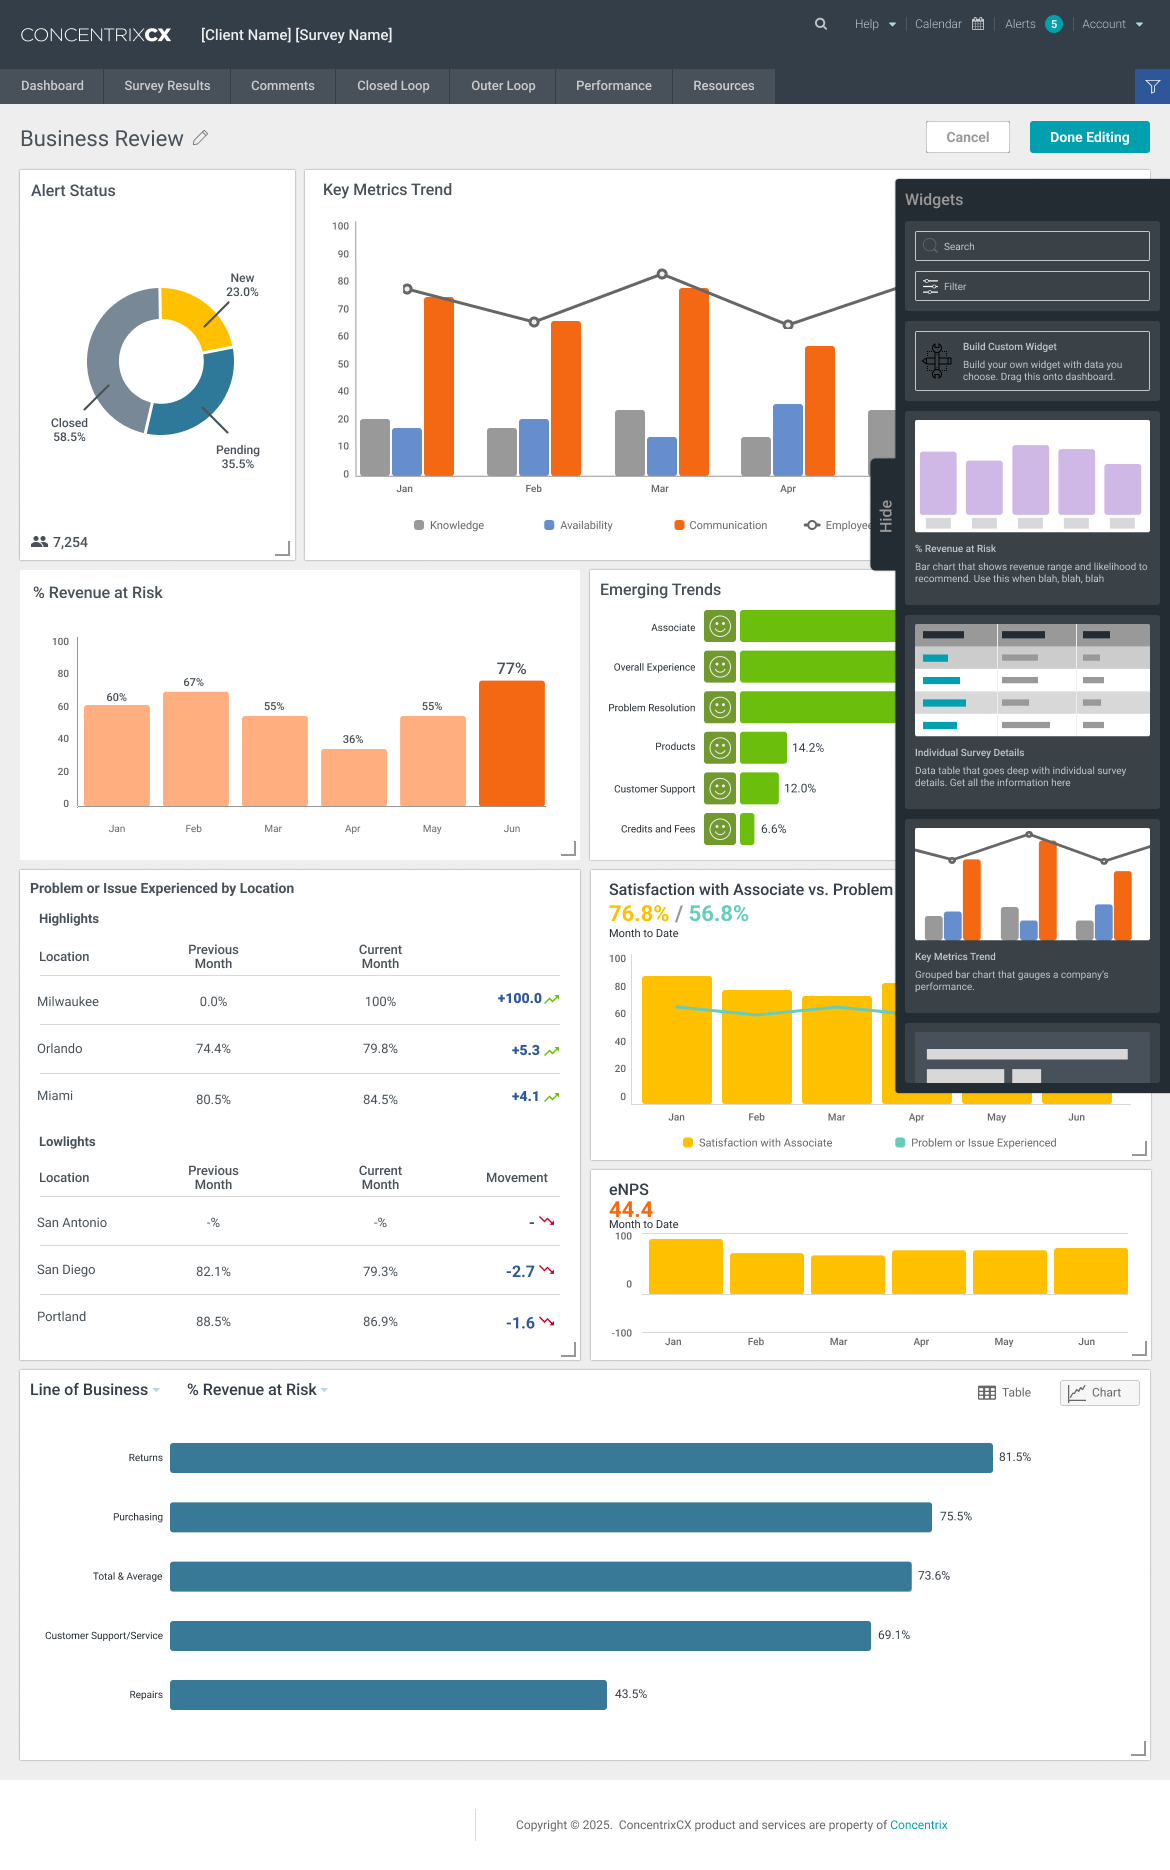
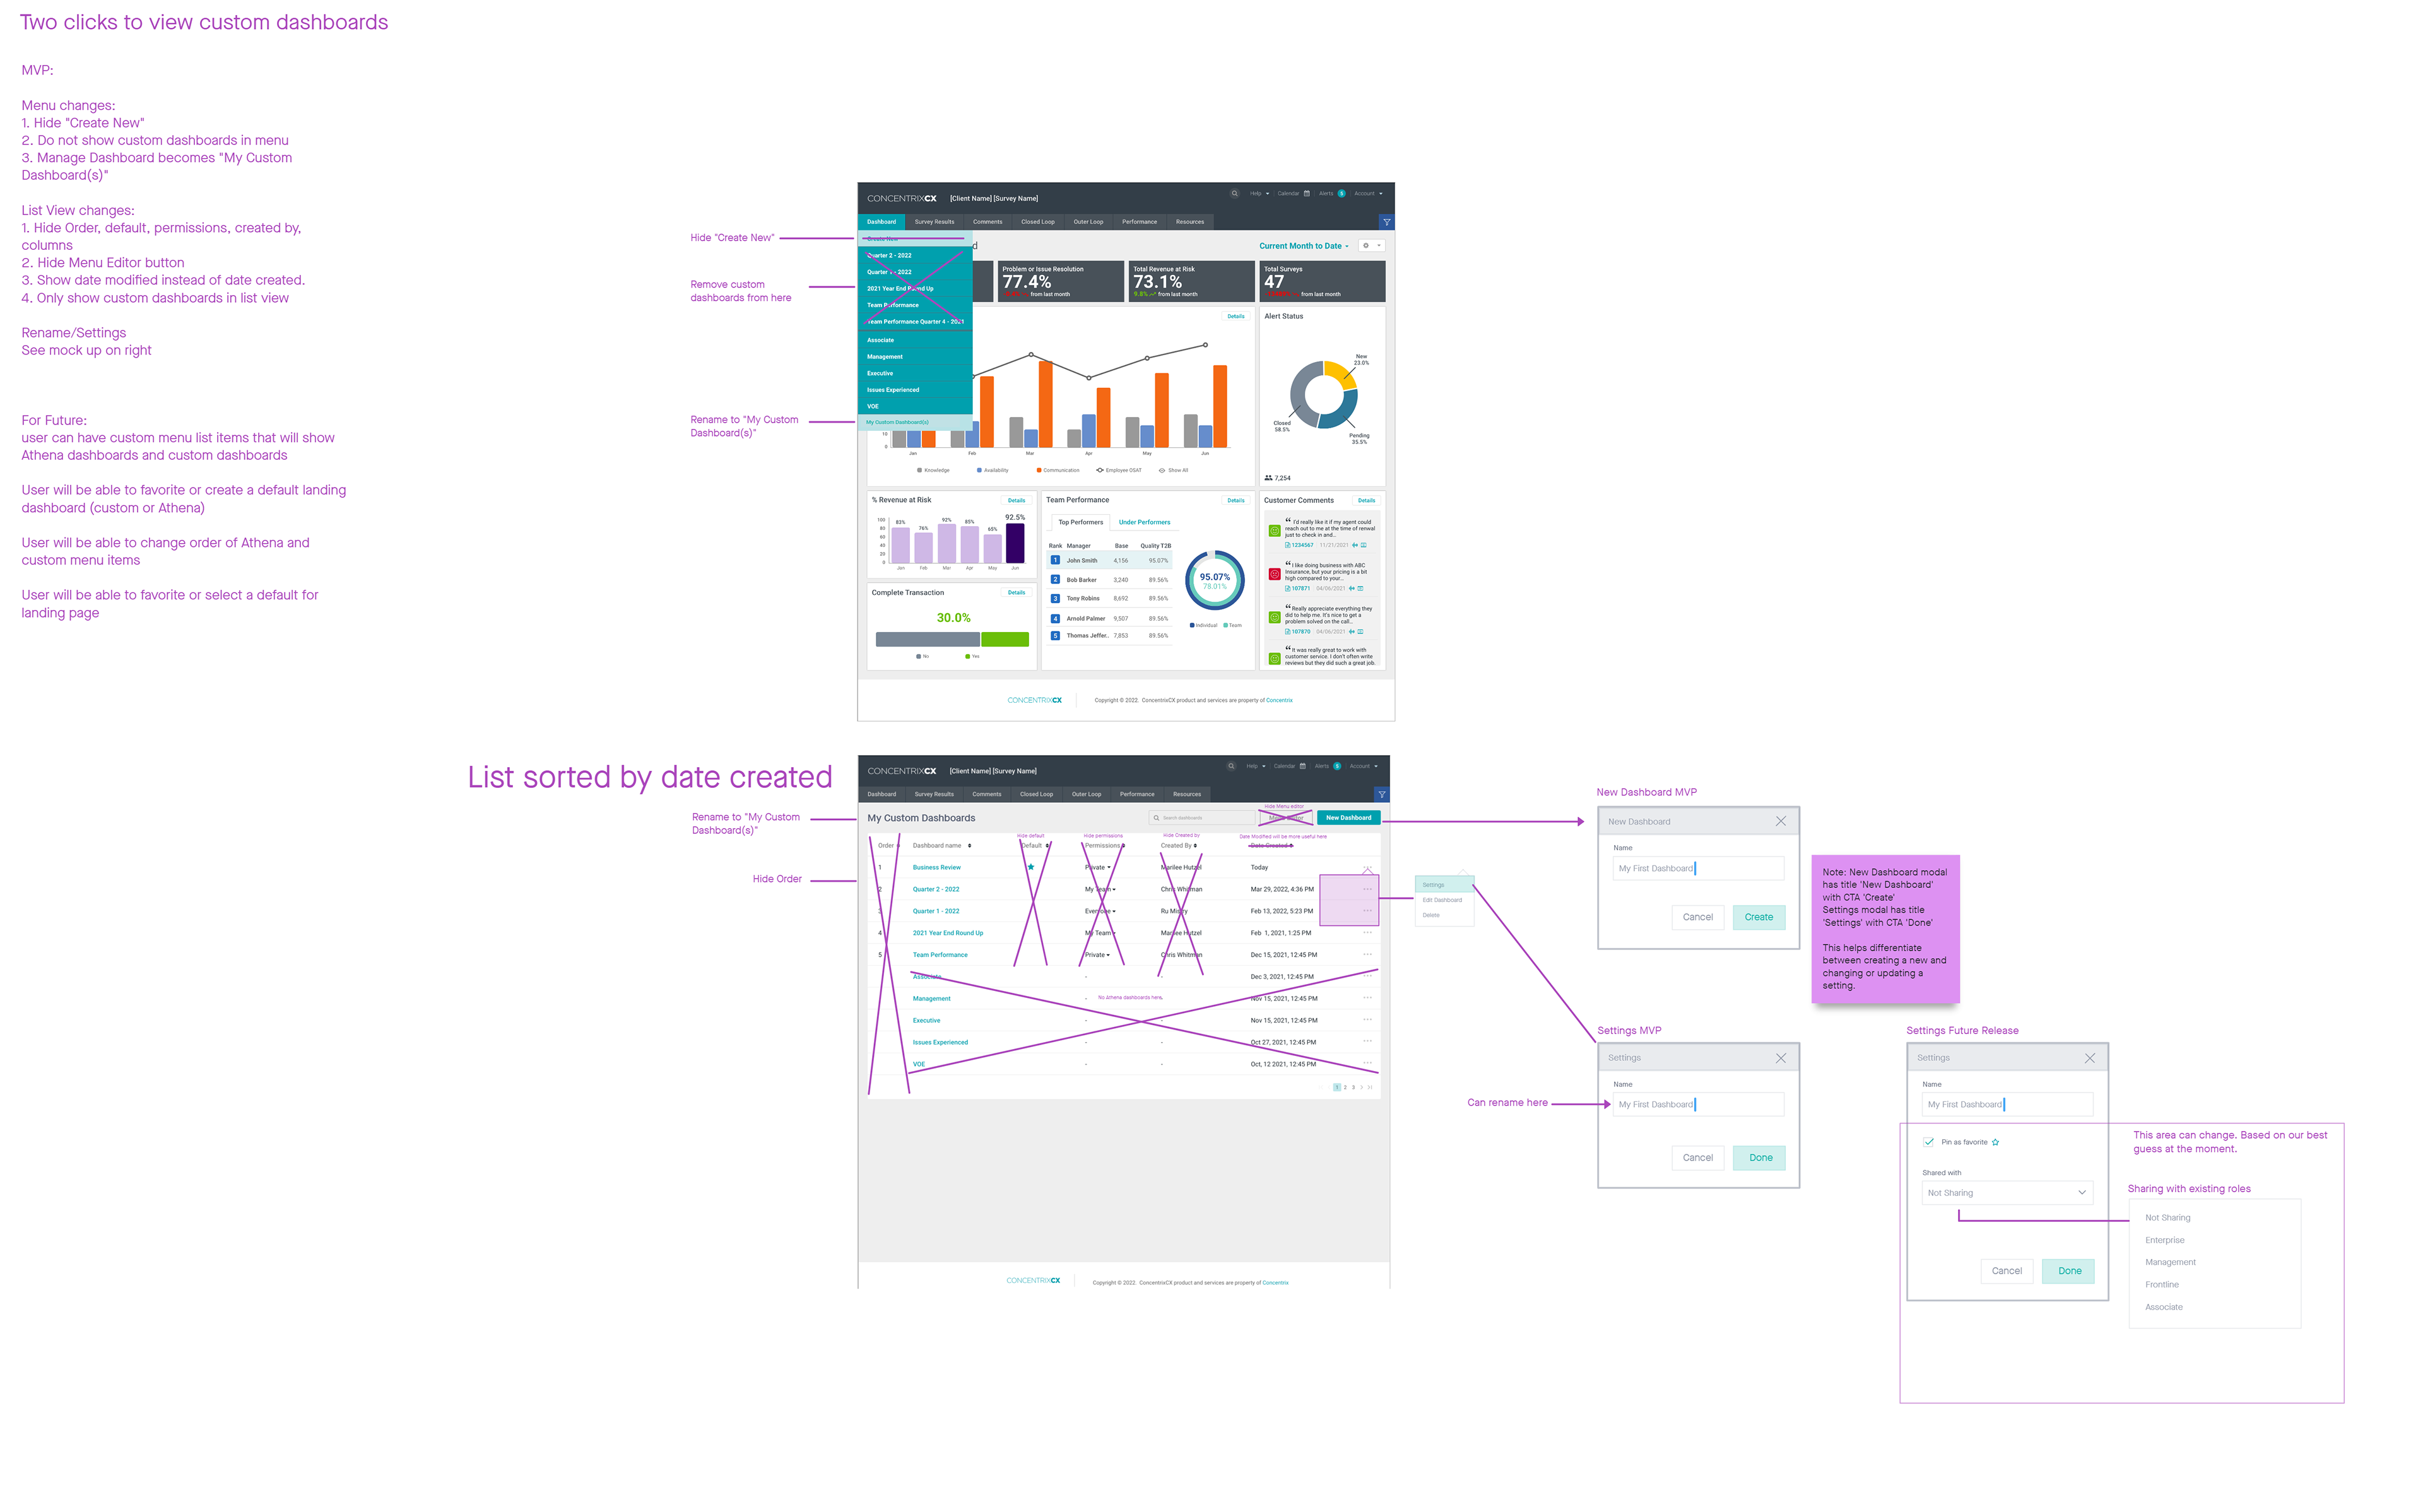
Hierarchy and Architecture
Needed to make sure that the new dashboard builder feature worked into the larger ecosystem already established. Found a way to add into the existing navigation with ways to access customized dashboard navigation drawer. Which was an added feature we created due to user testing and interviews. Also wanted to focus on making the navigation as flat as possible to eliminate deeply nested navigation structures.
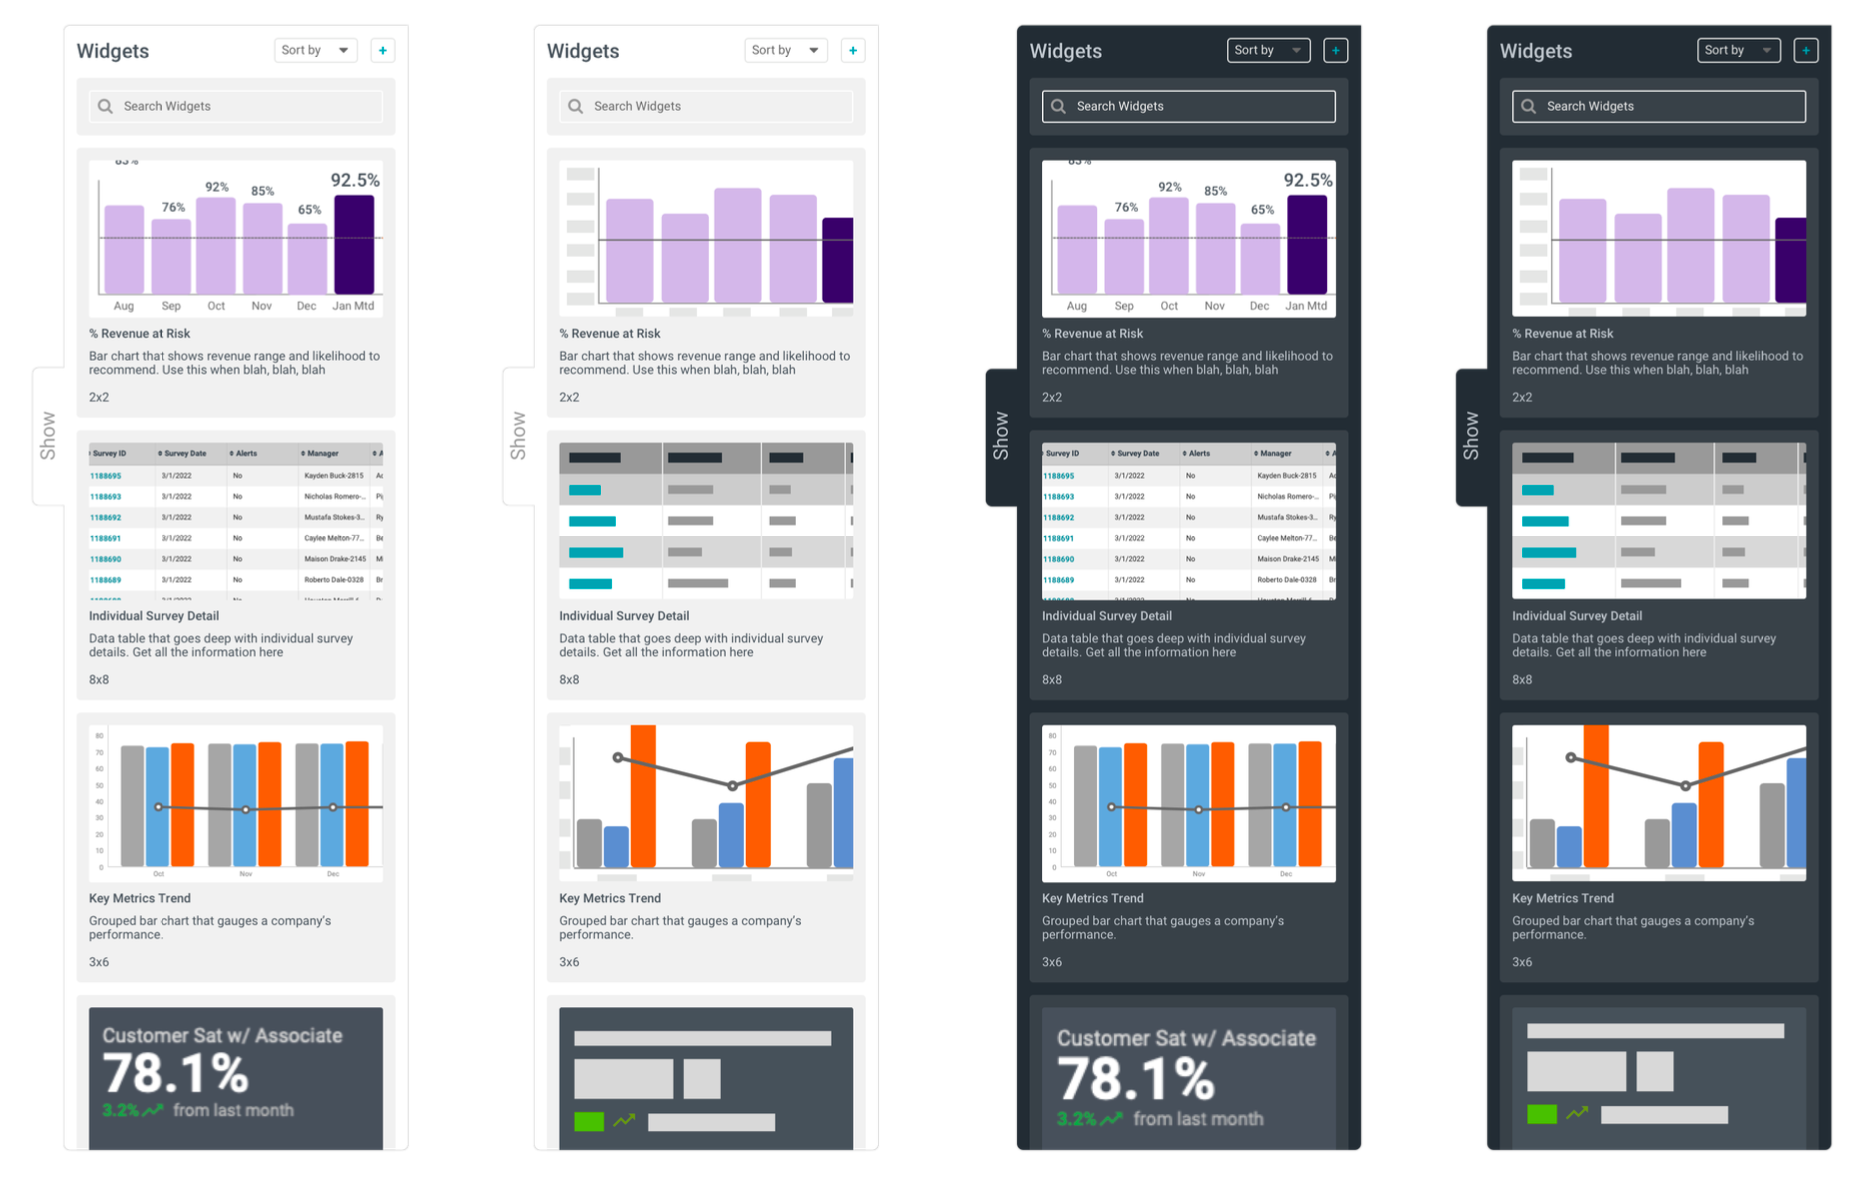
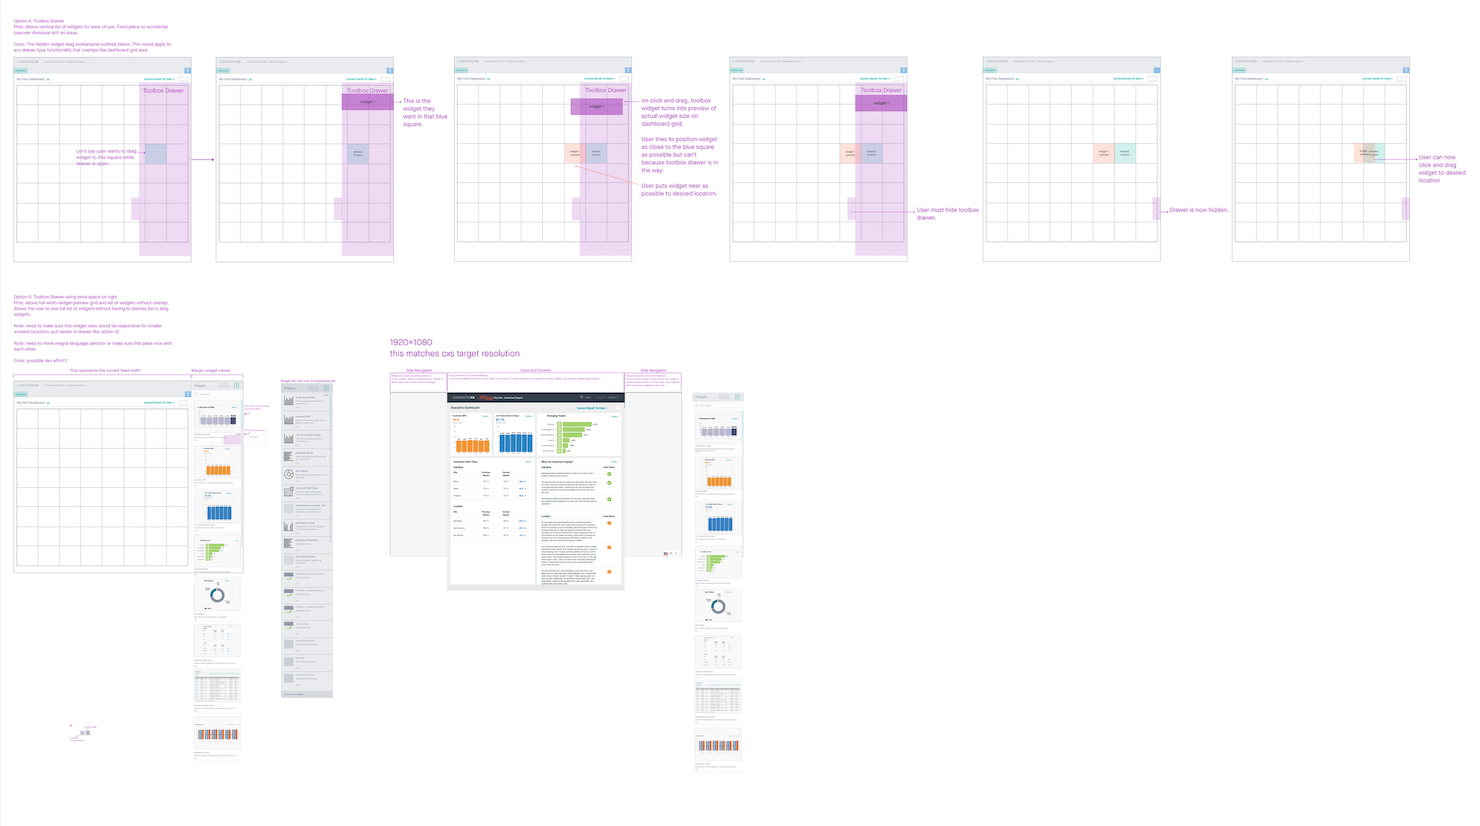
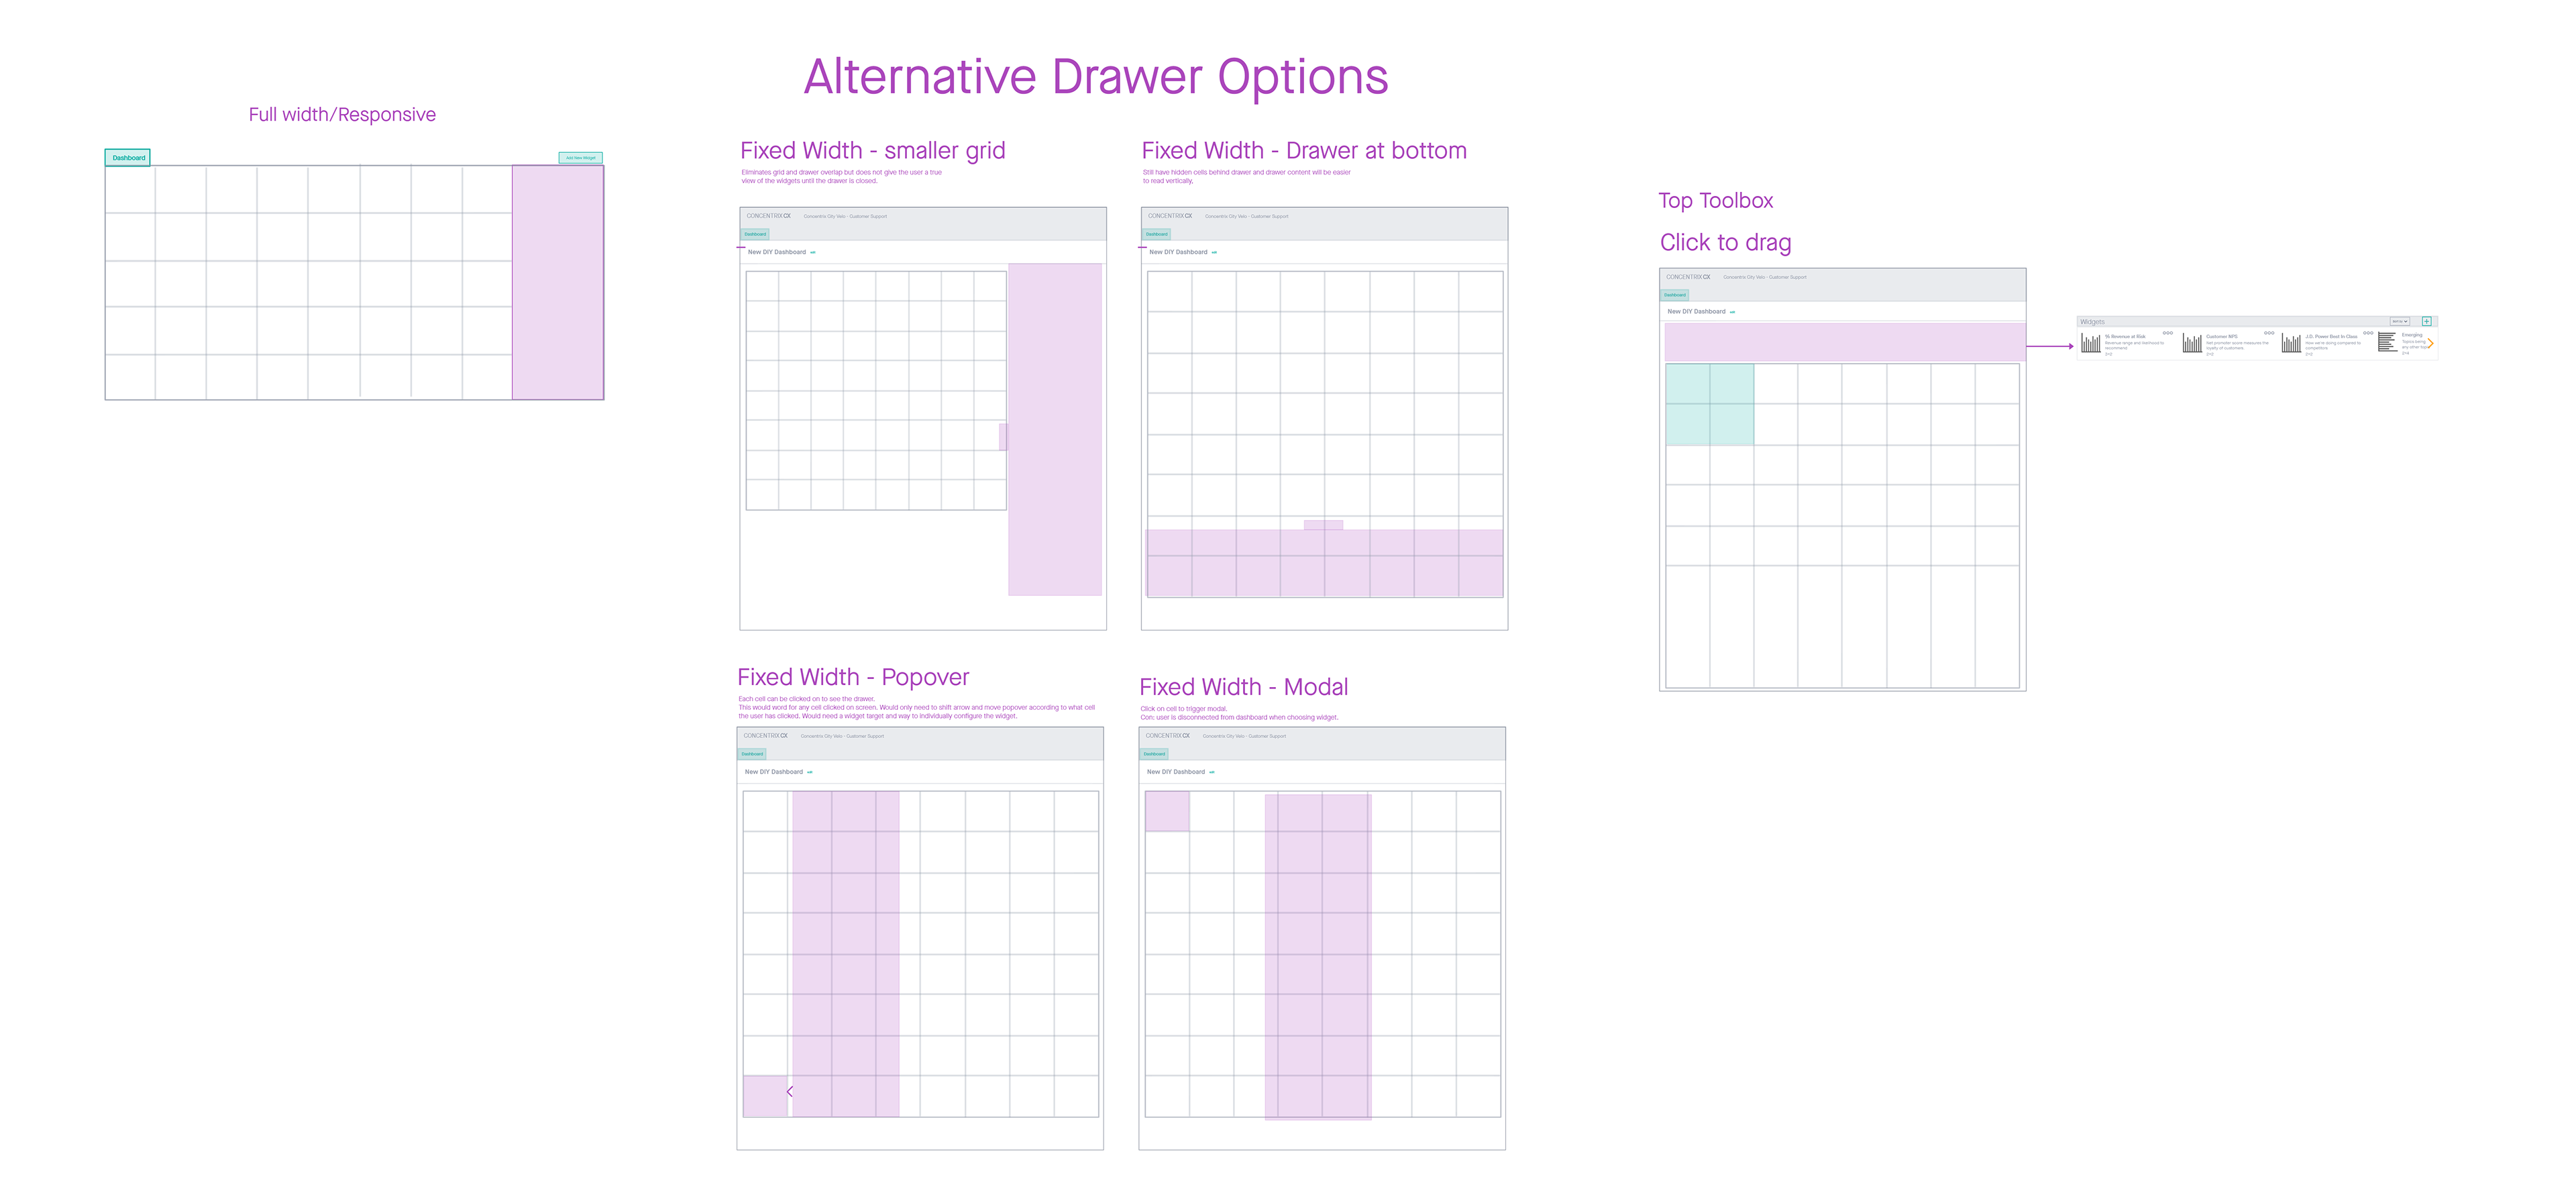
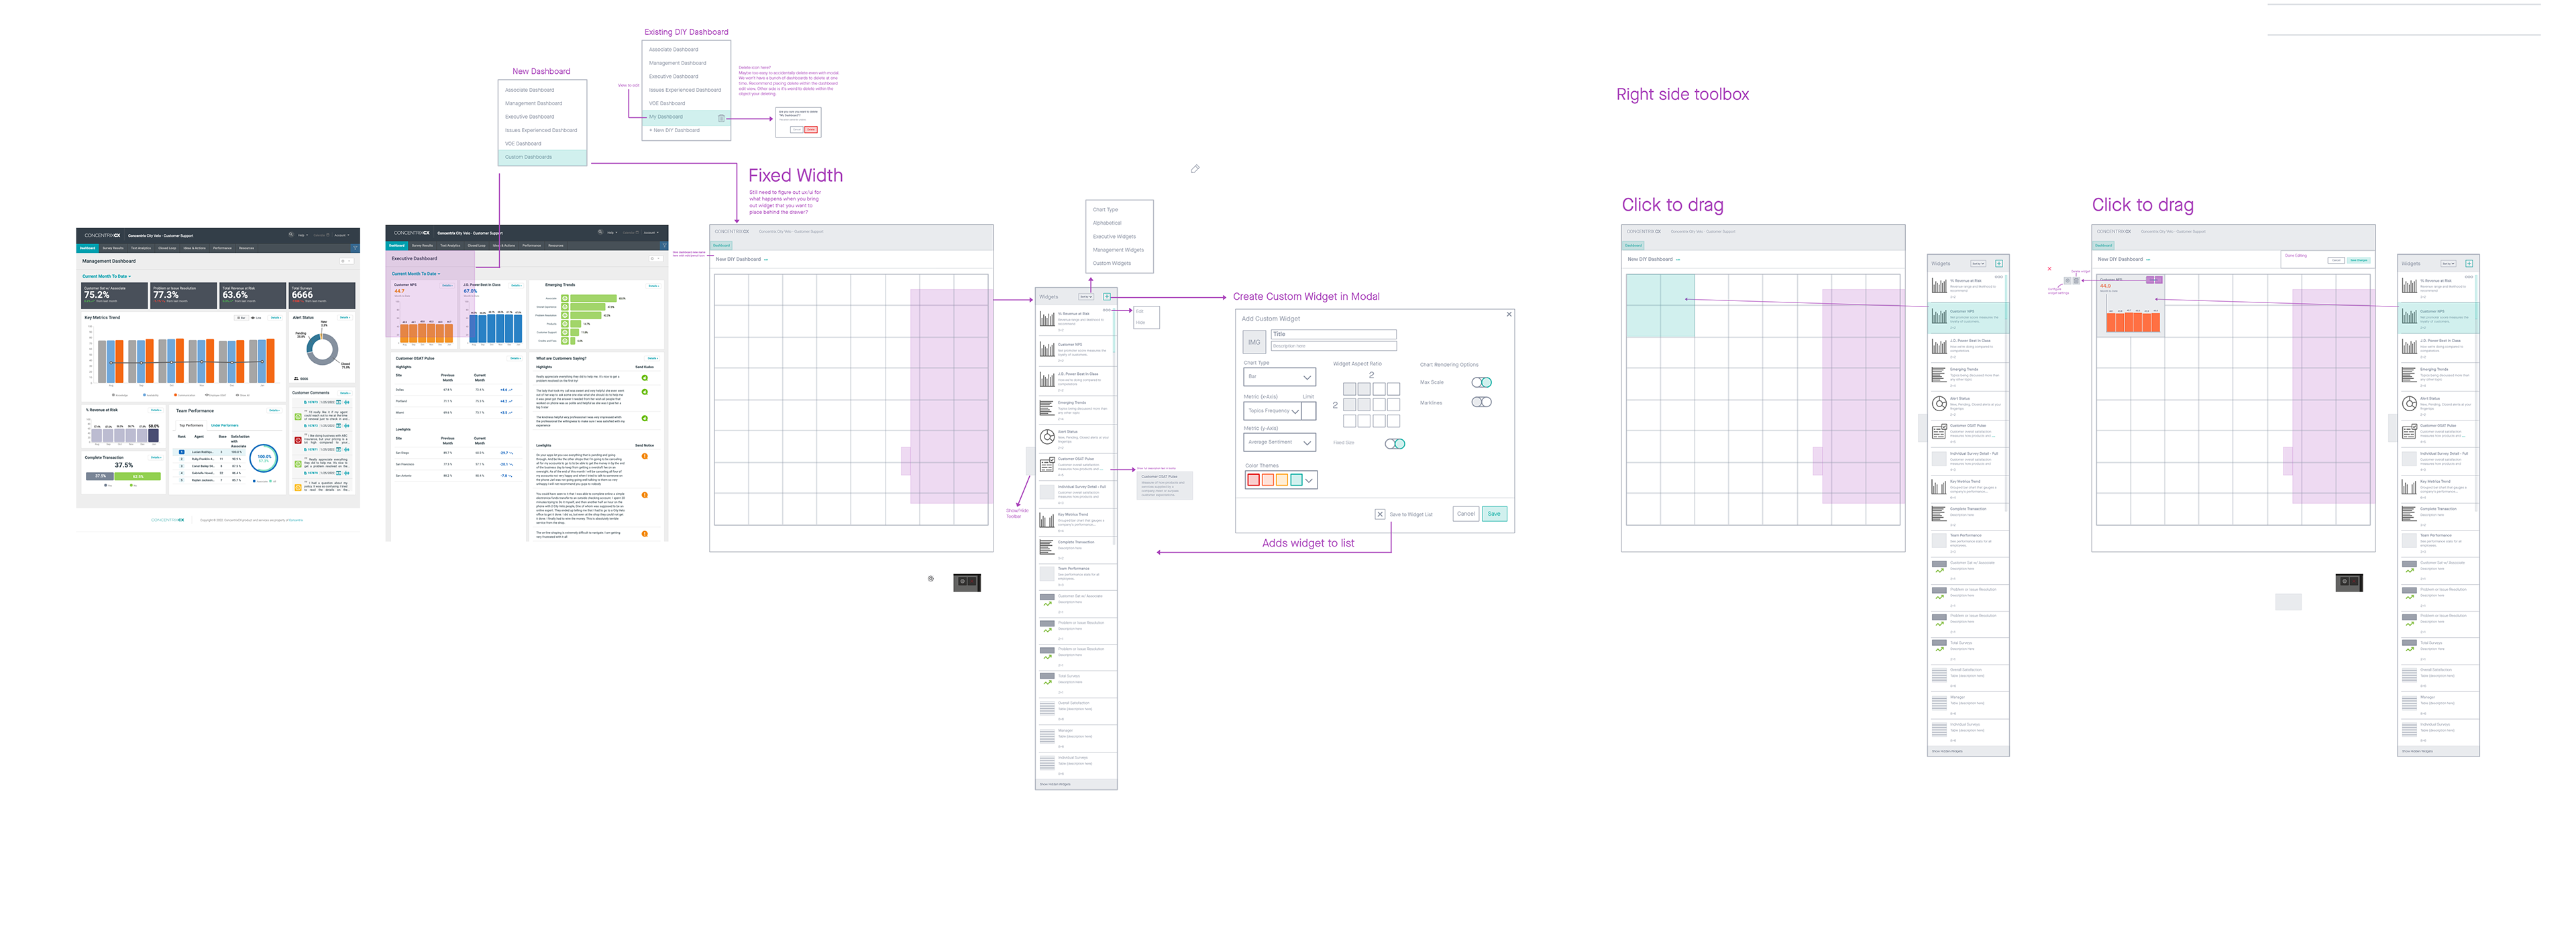
Wireframes and Multitasking
I created low-fidelity wireframes to explore multiple layout options—grid, free-form, and responsive behavior—while carefully considering how the experience would adapt on smaller screens, where the drawer could overlap the grid below. Because two separate development teams were working in parallel on related initiatives, I coordinated closely with both to align timelines and design decisions. At the same time, the broader website redesign aimed to deliver a fully responsive page, so I designed the DIY Dashboard experience to work seamlessly across both the new responsive framework and the existing environment.
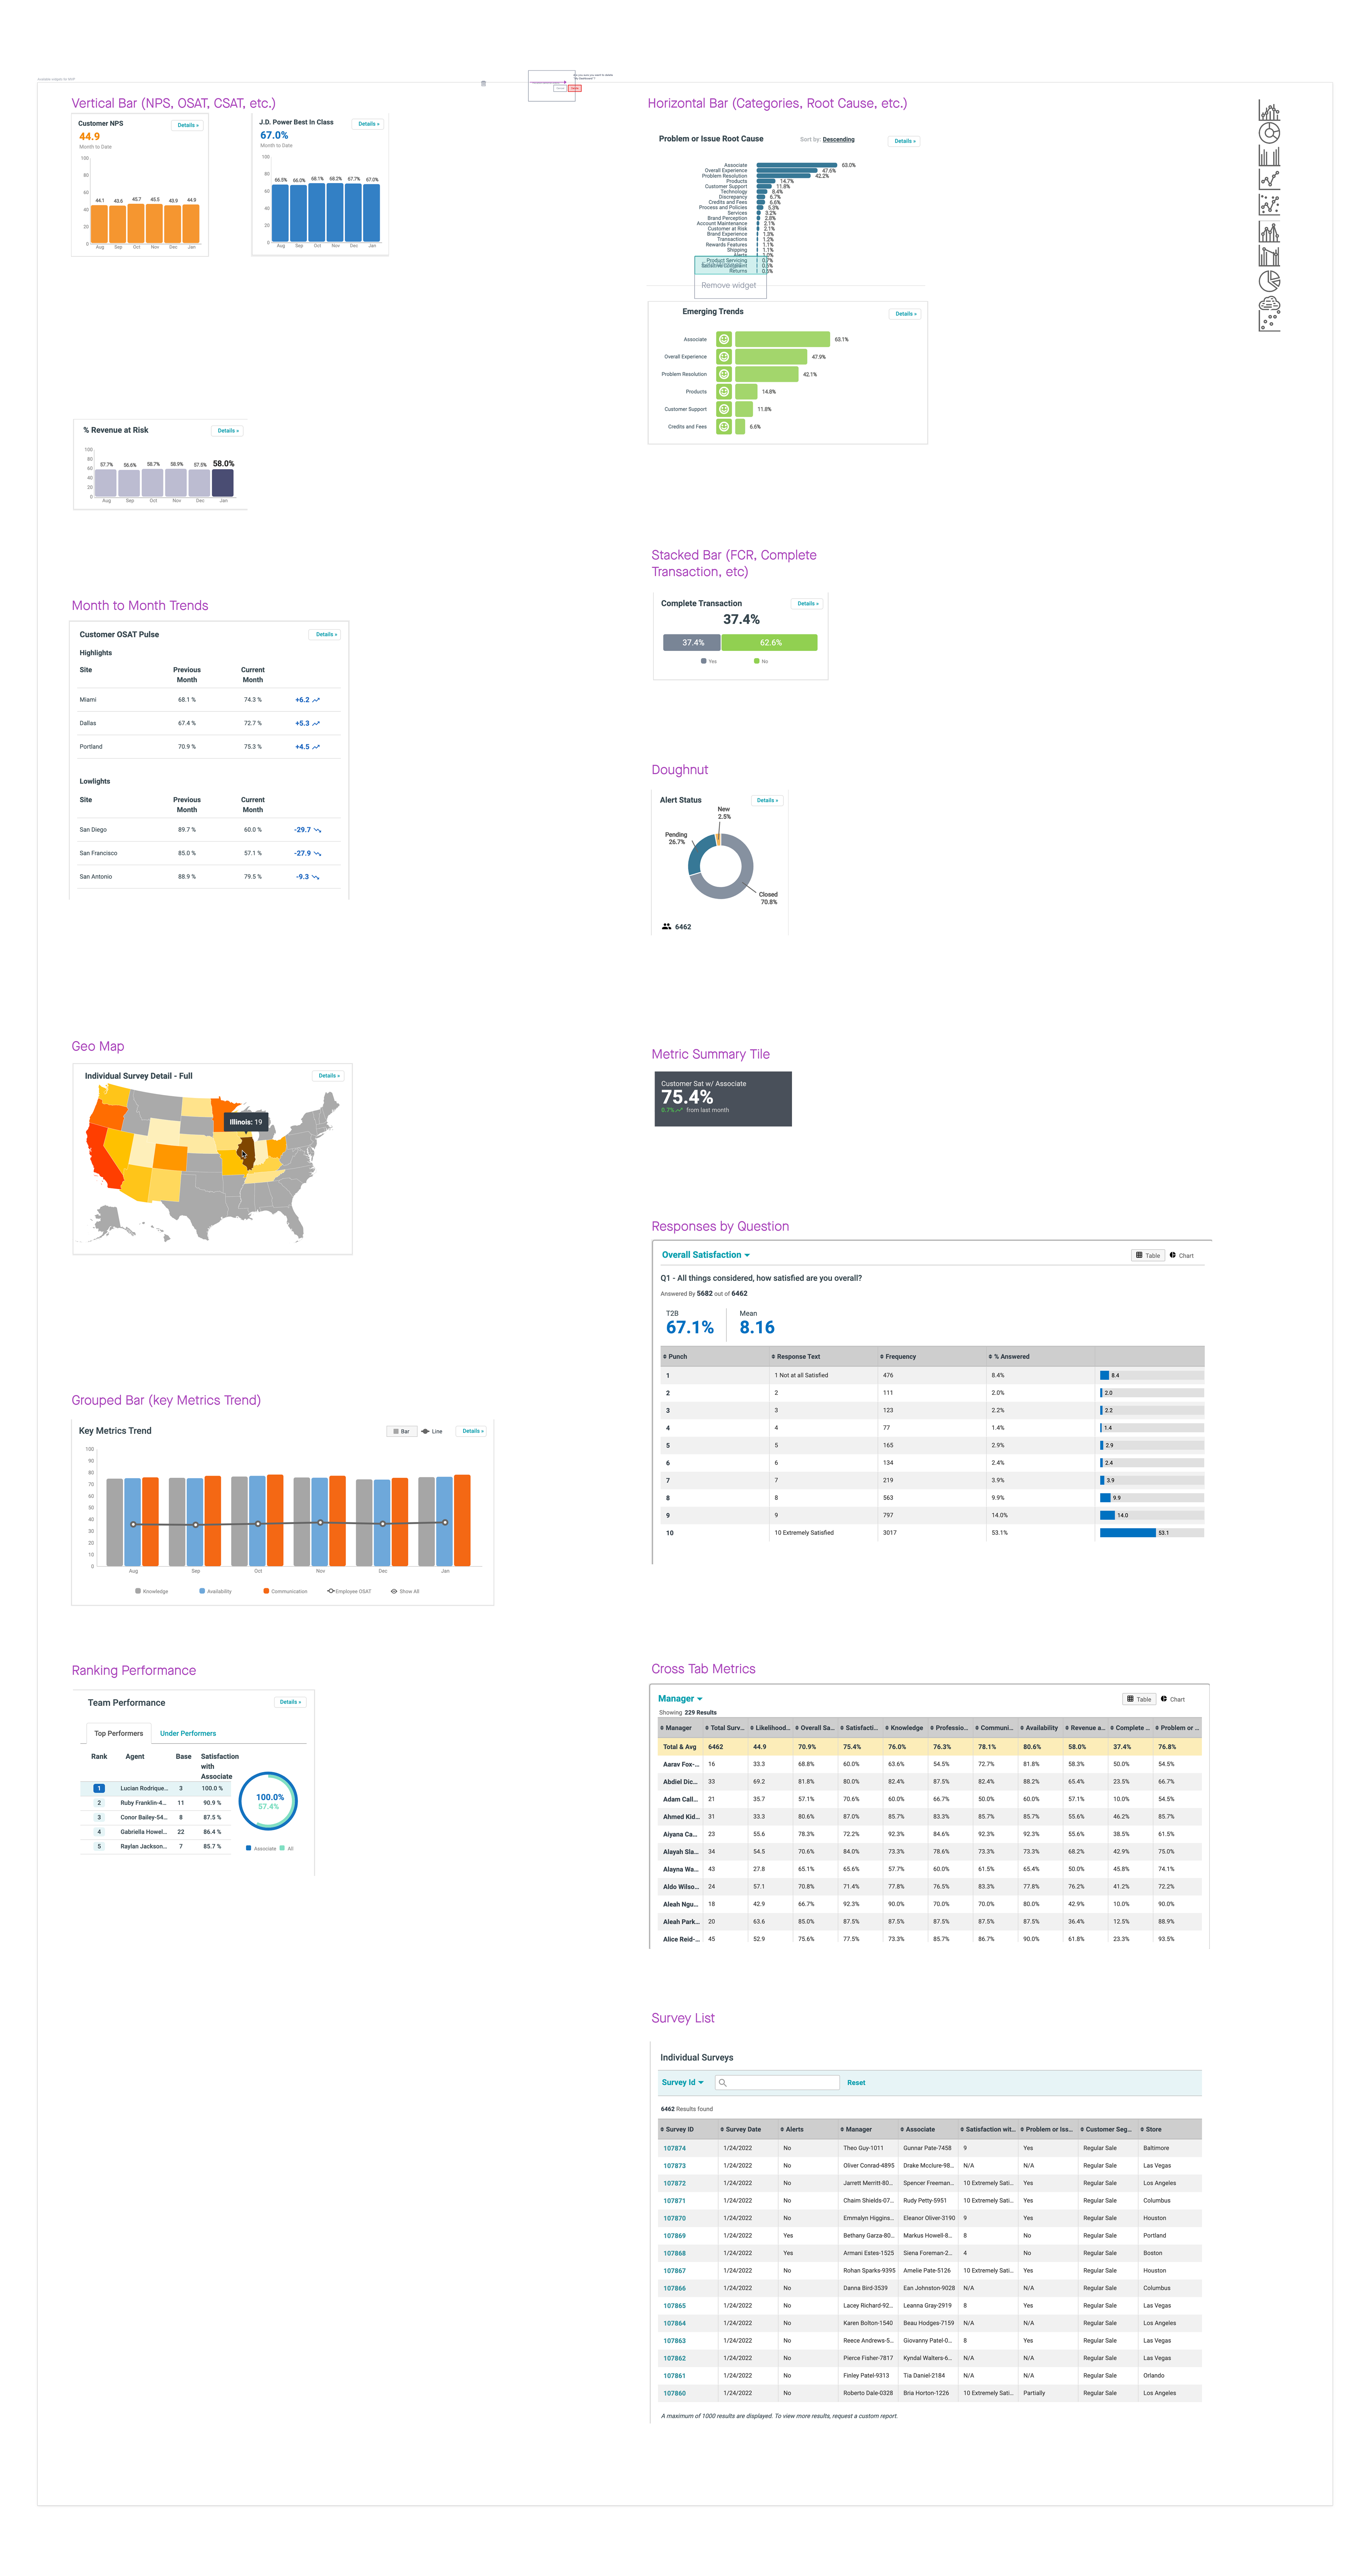
Defining Chart MVPs
Defining what charts would be included in the first rollout was a process of communication between internal stakeholders and clients to find the best balance between complexity of chart dev time and importance of the data.
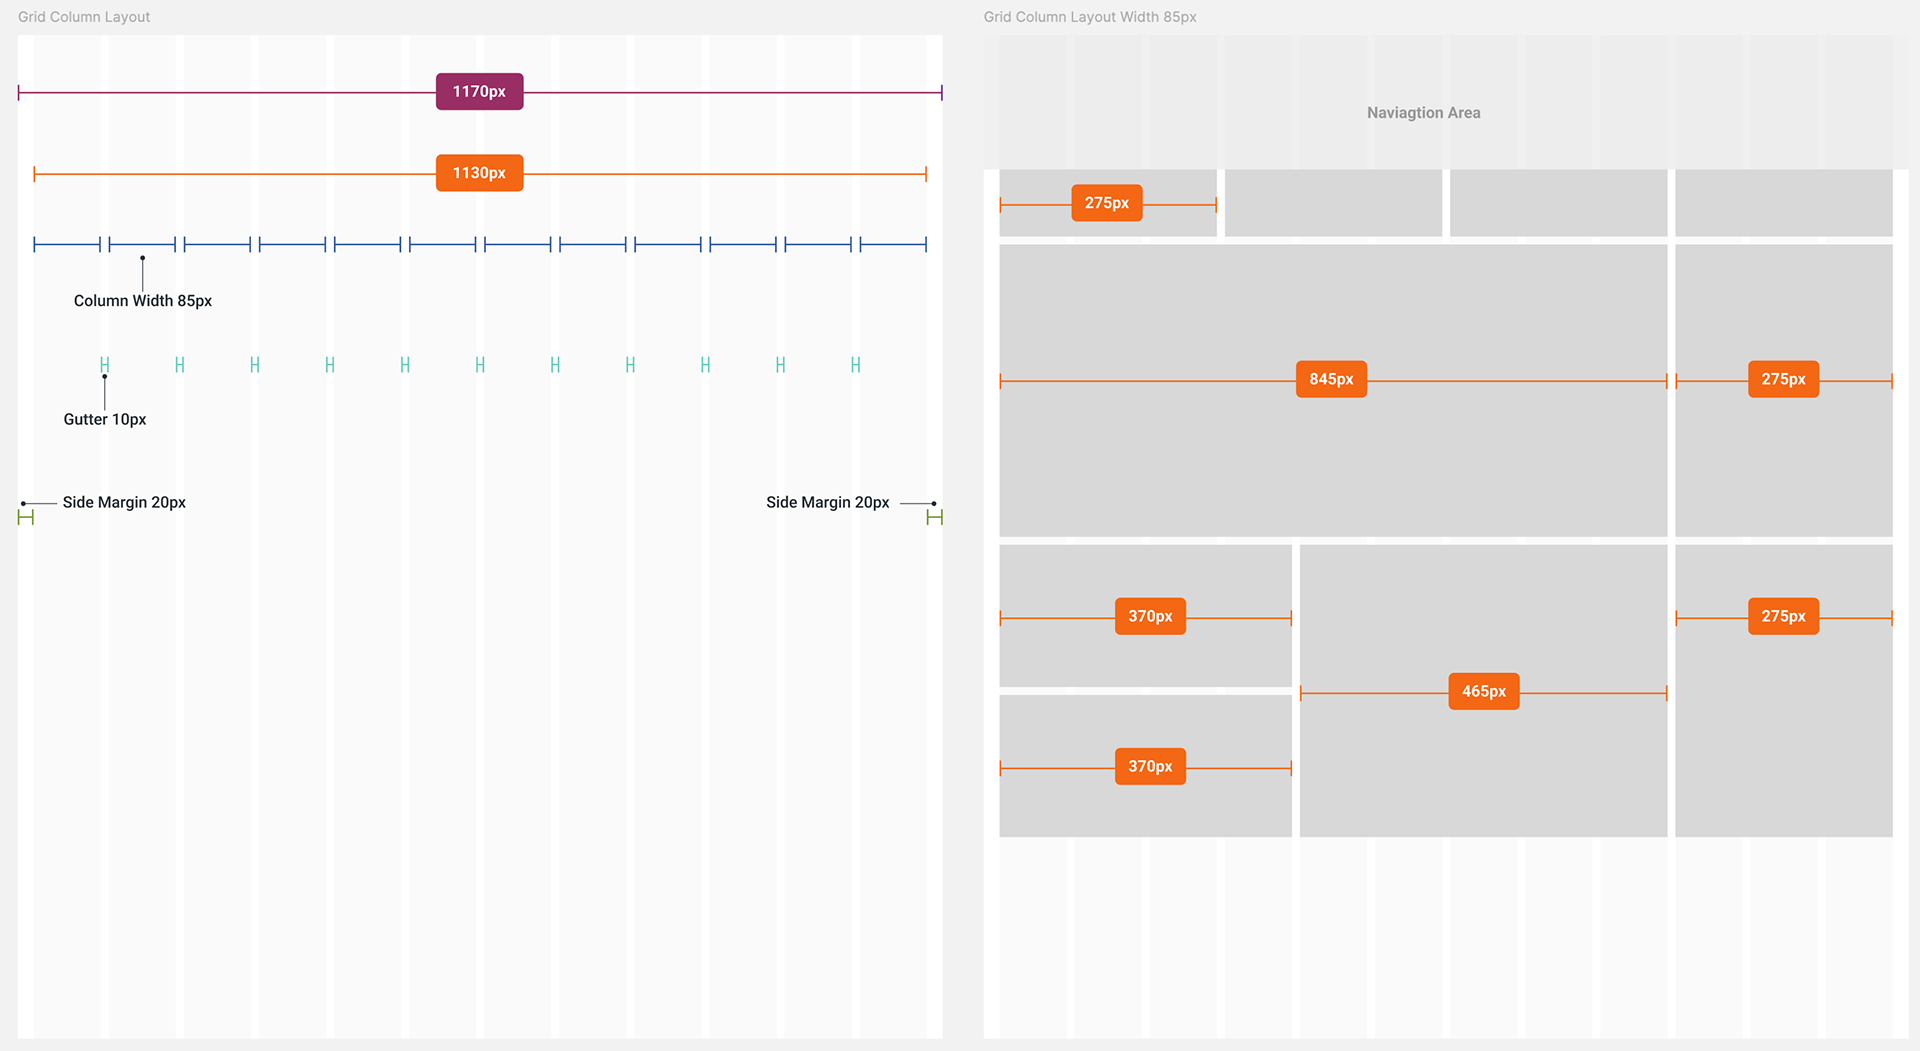
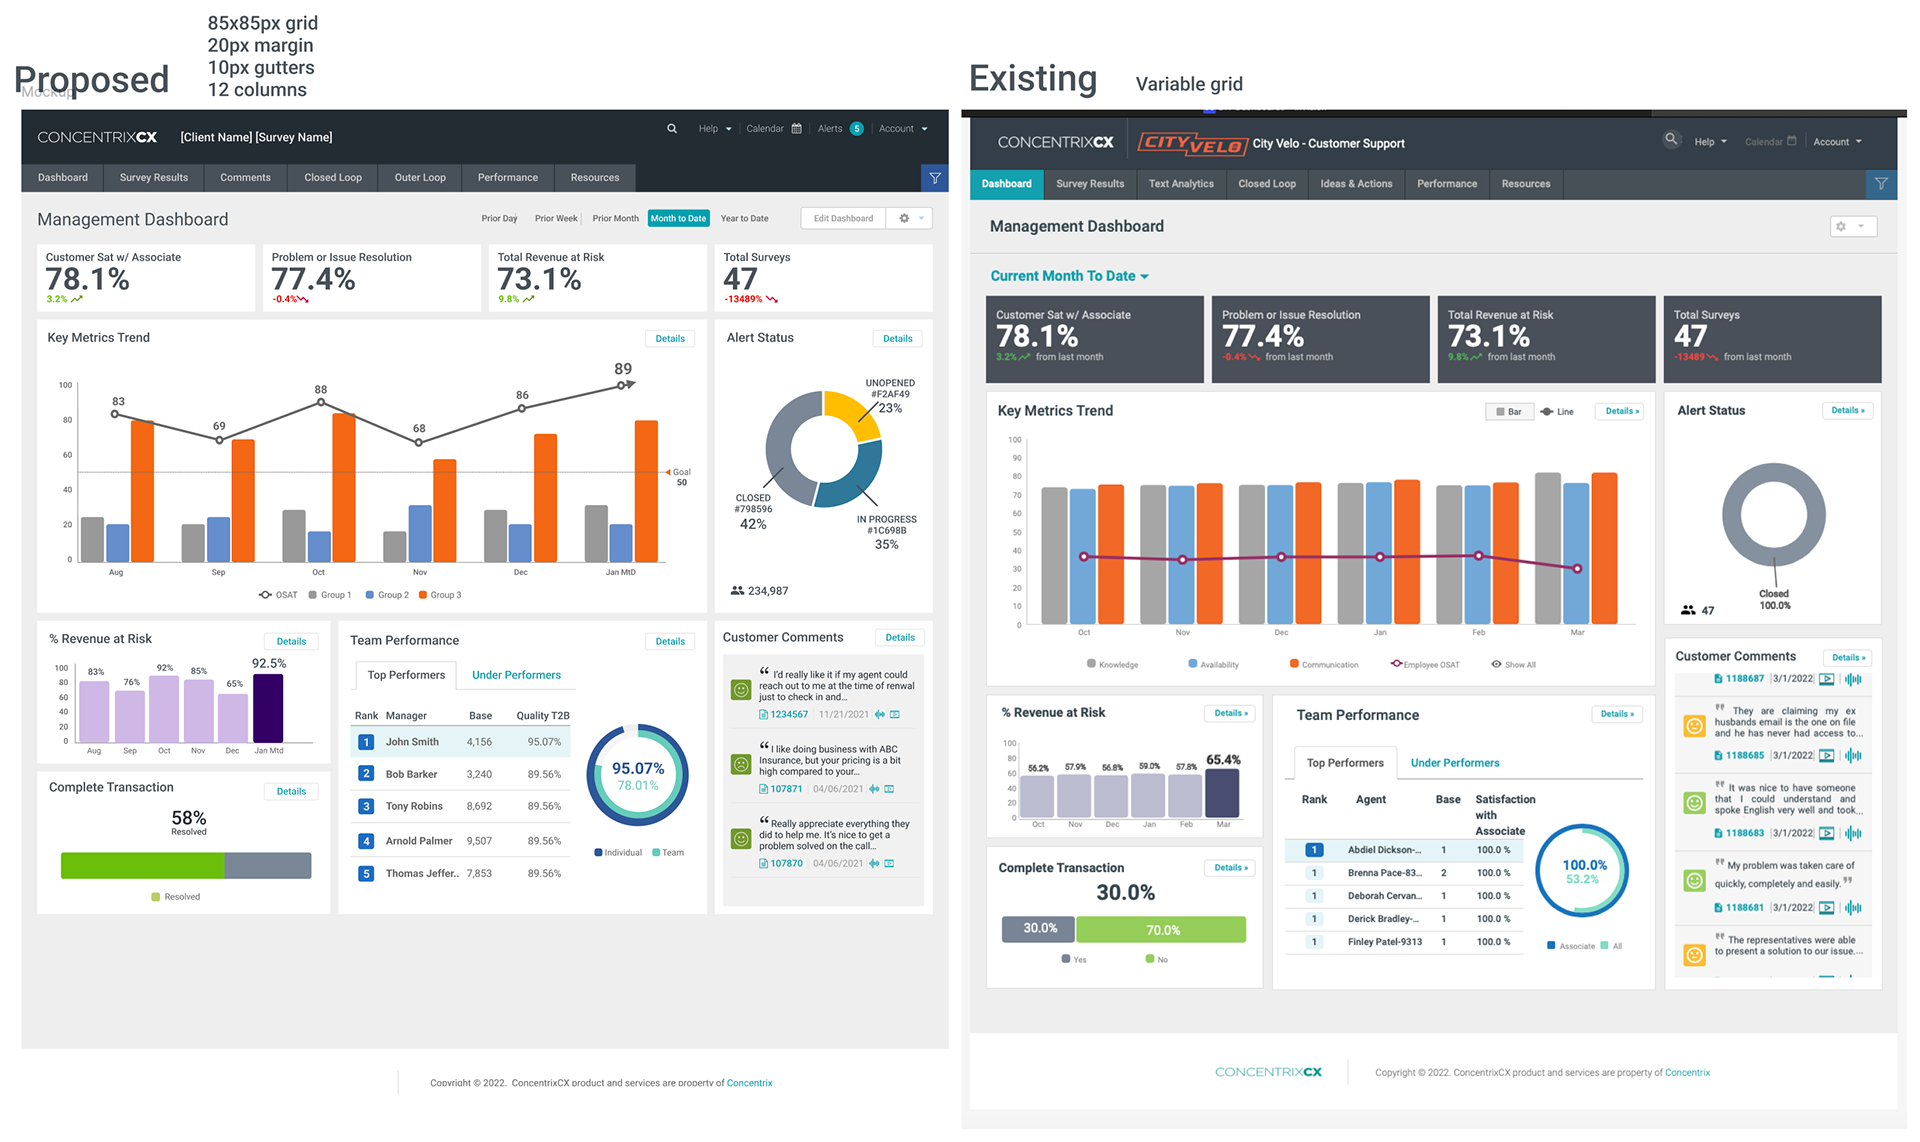
Grid is Your Friend
Much like my design professor in college said, "the grid is your friend"
2nd Round of Wireframes
User interview feedback led to expanding and creating more detailed wireframes. With the addition of a customized color picker so analysts can create their own favorite themes.
High fidelity light and dark mode chart picker drawer options.