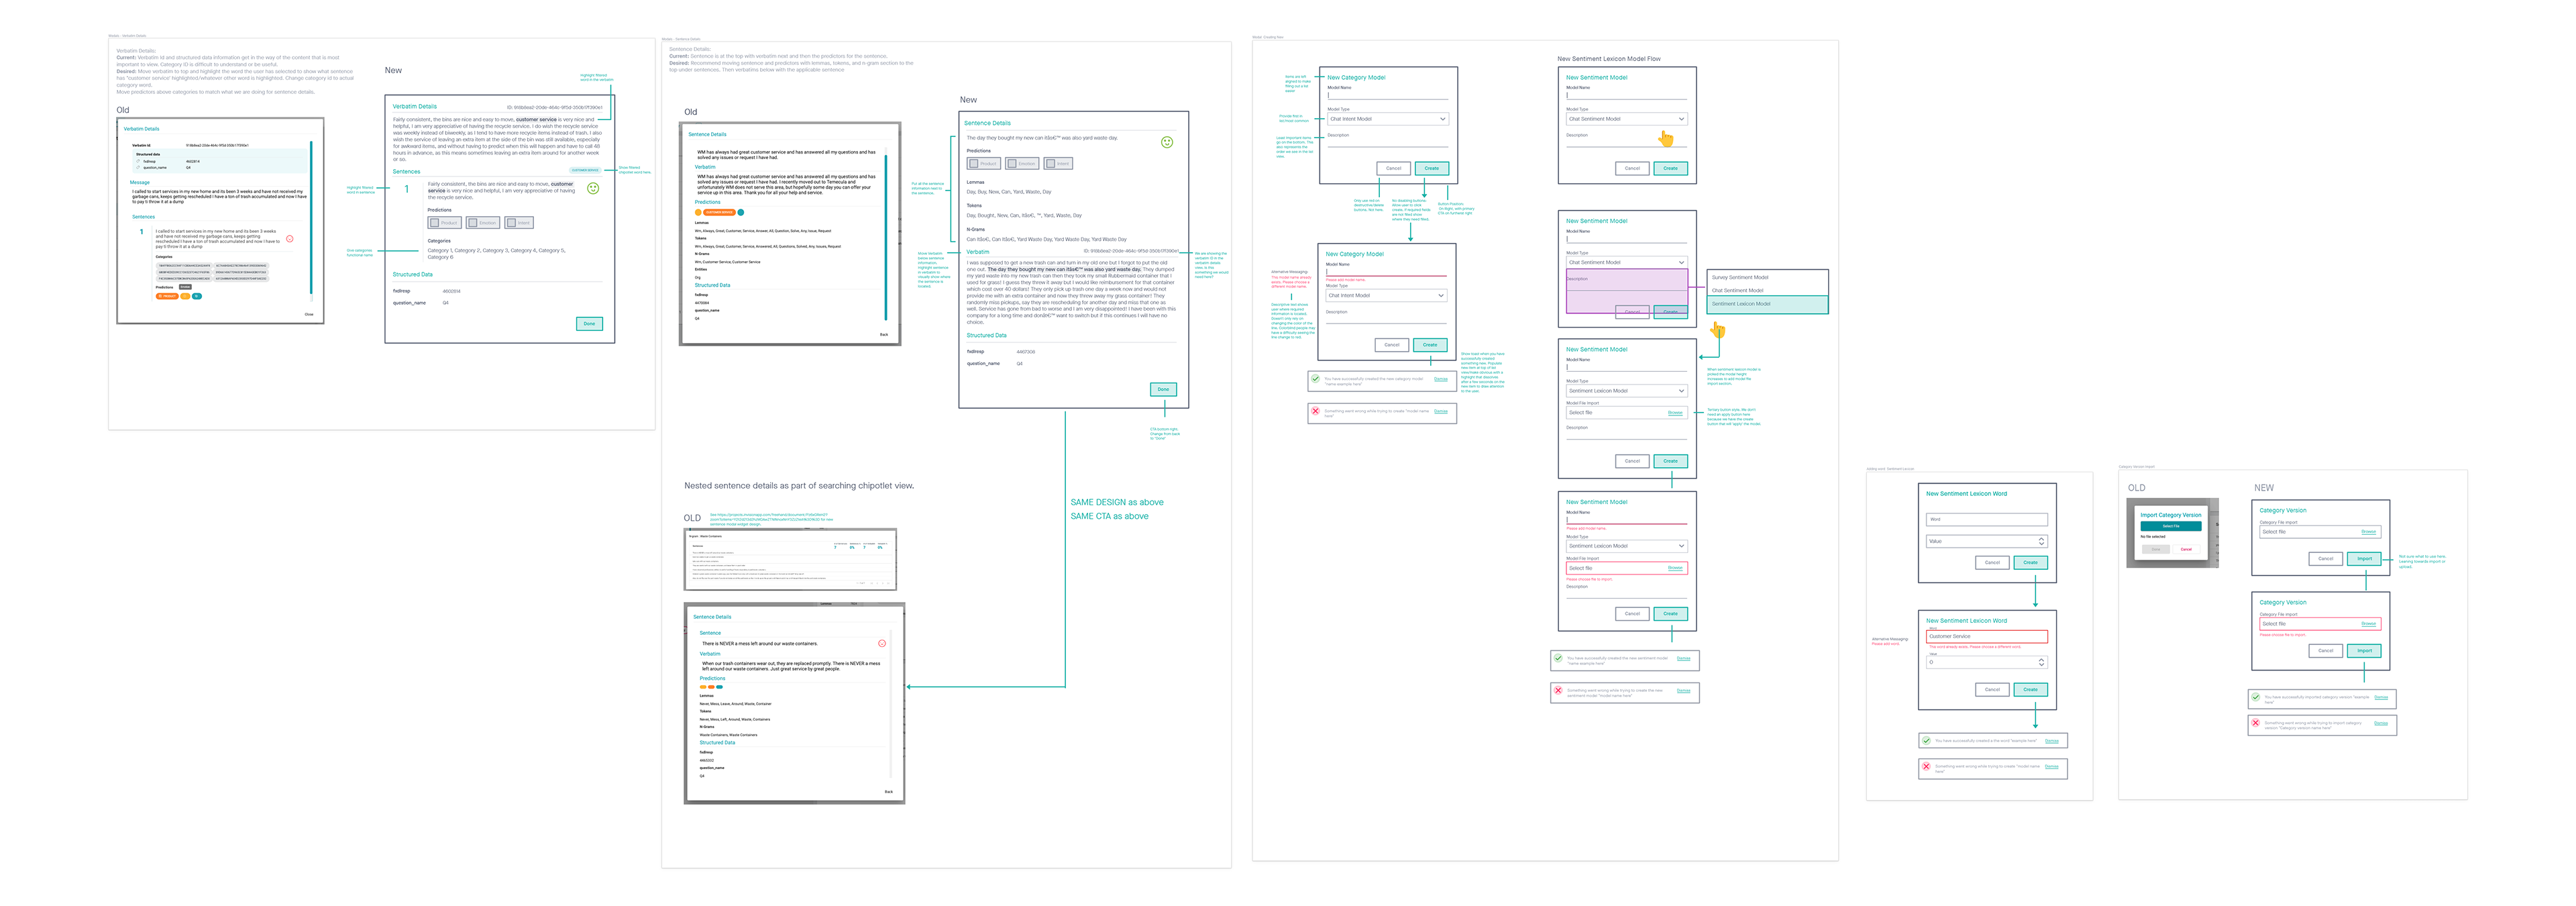
Wireframes
Wireframe mockups for a portion of the CXS product. Working through verbatim and sentence details and creating new categories. Process of unifying user experience across multiple areas of the product offering.
Training The Model
We needed a way to define categories to create L1 and L2 file structures, label the categories, gather examples and assign them to the correct category which in turn helps train the model by learning patterns and predicting categories for new data. Above we see the full power of the CXS category builder tool. Your multiple data sources are along the top with the model structure on the left. The goal is to find unstructured sentences and put them into categories. You can then run the model and continue to make it more accurate.
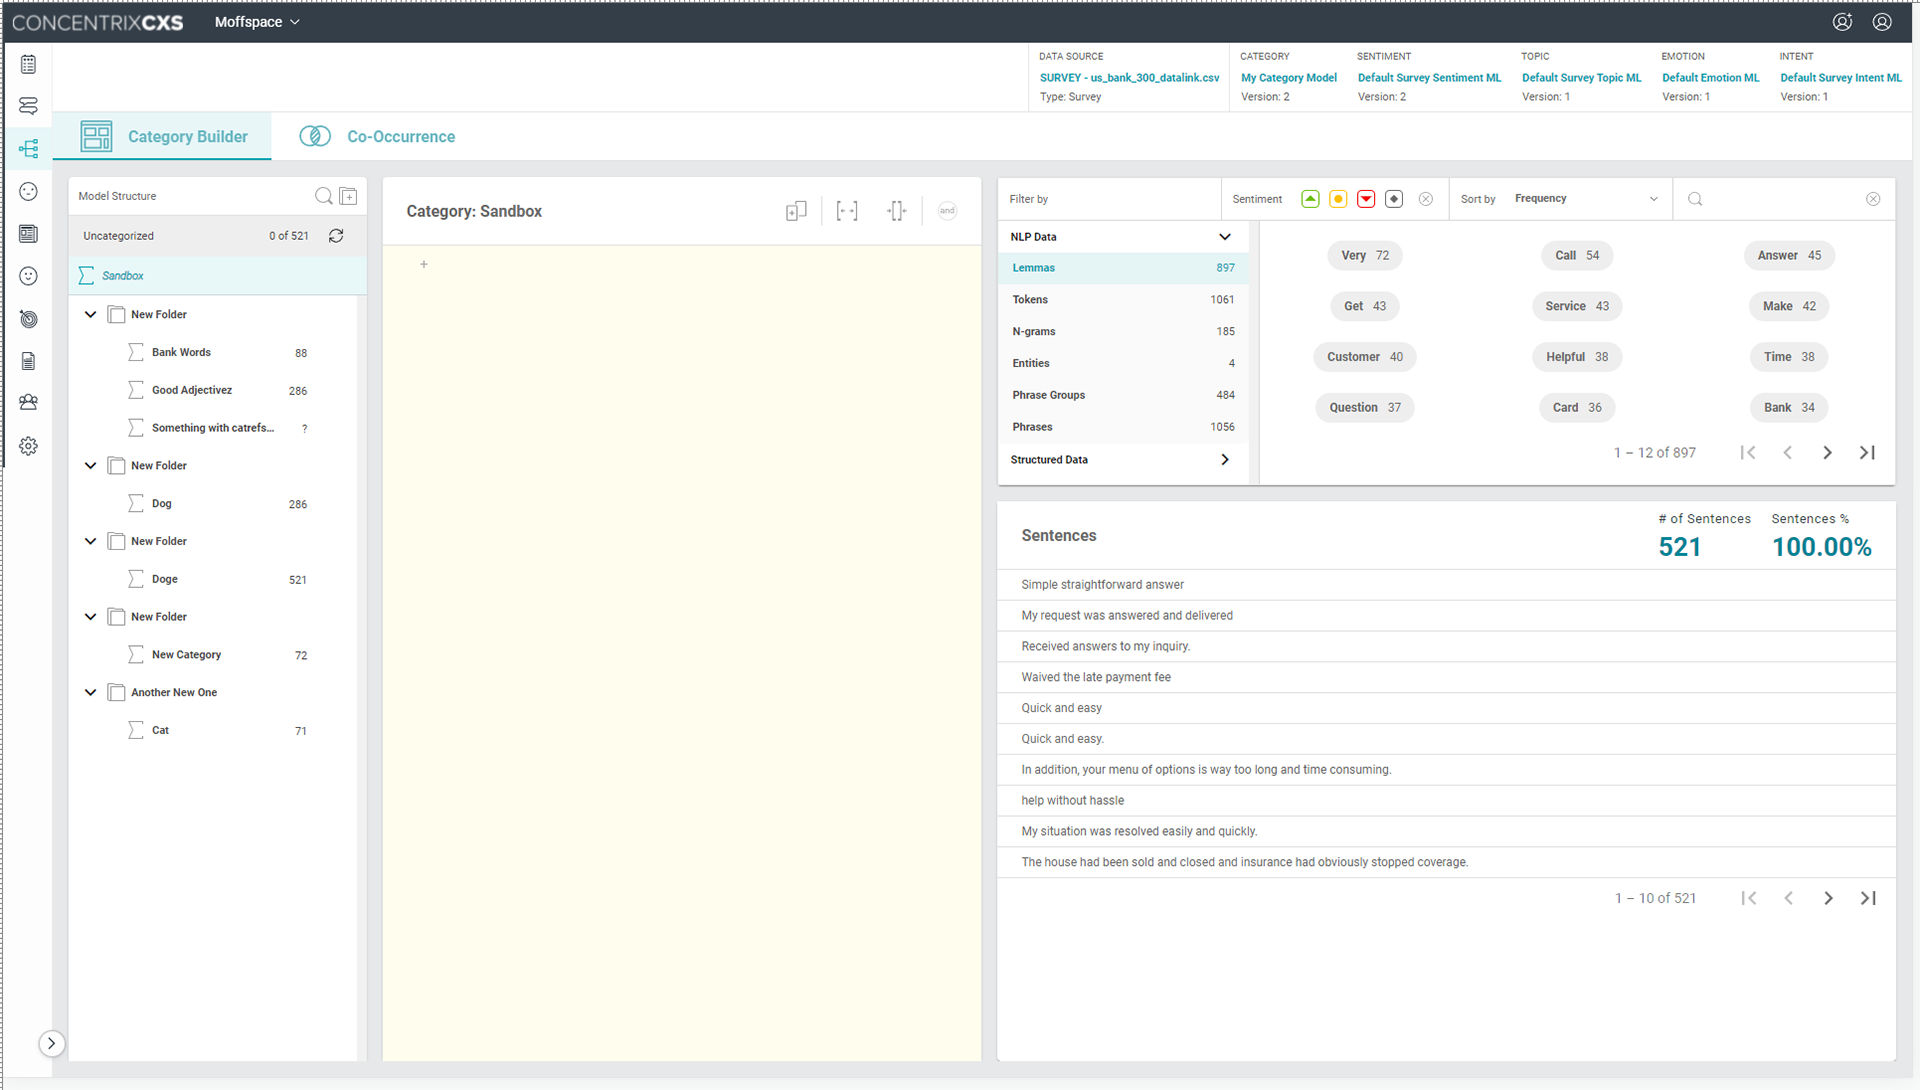
CXS Category Builder
Confusion Matrices
Working closely with dev and PHD colleagues I learned about confusion matrices and how utilizing these tools would help analysts understand their data in terms of true positives, true negatives, false positives, and false negatives. I then created a user interface that (with the assistance of predictive analytics) made it easier to configure unstructured data which would in turn help train the ML model.
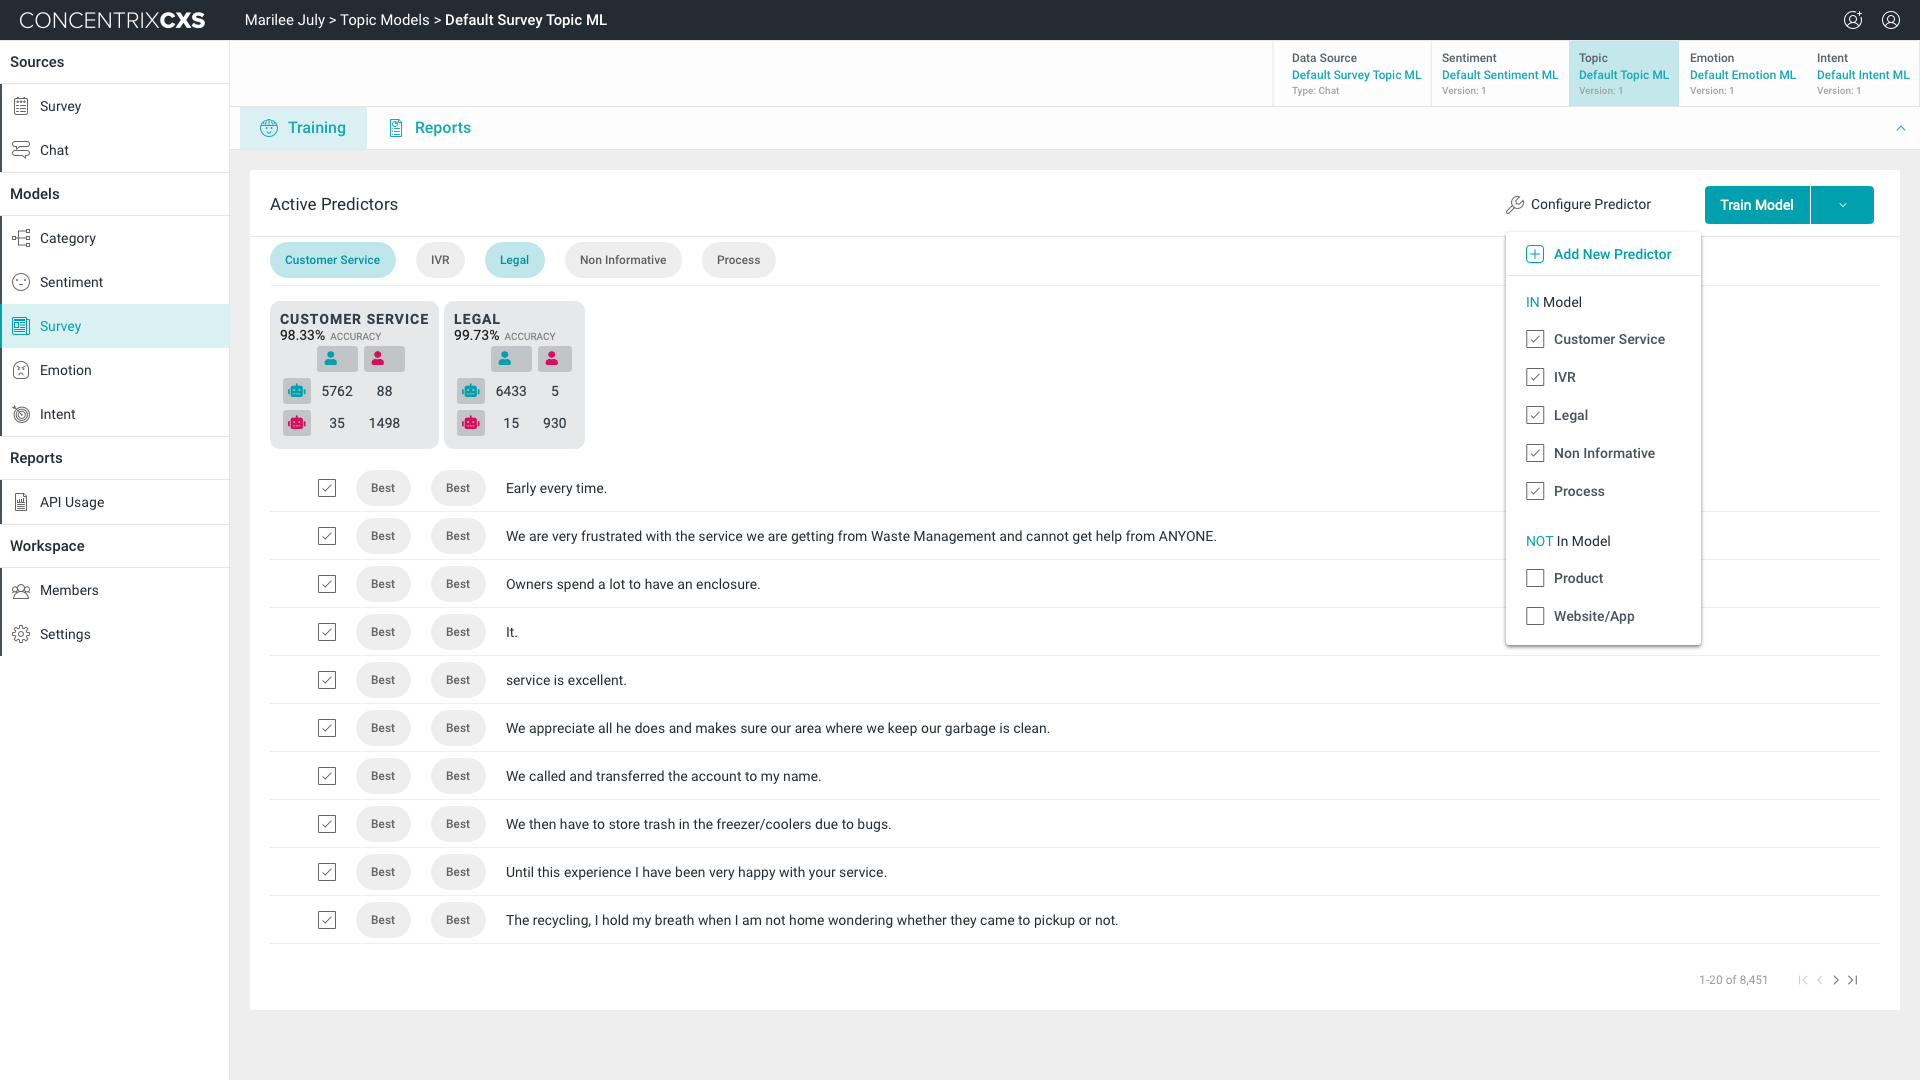
CXS Training the Model Using Confusion Matrices and Predictive Analytics
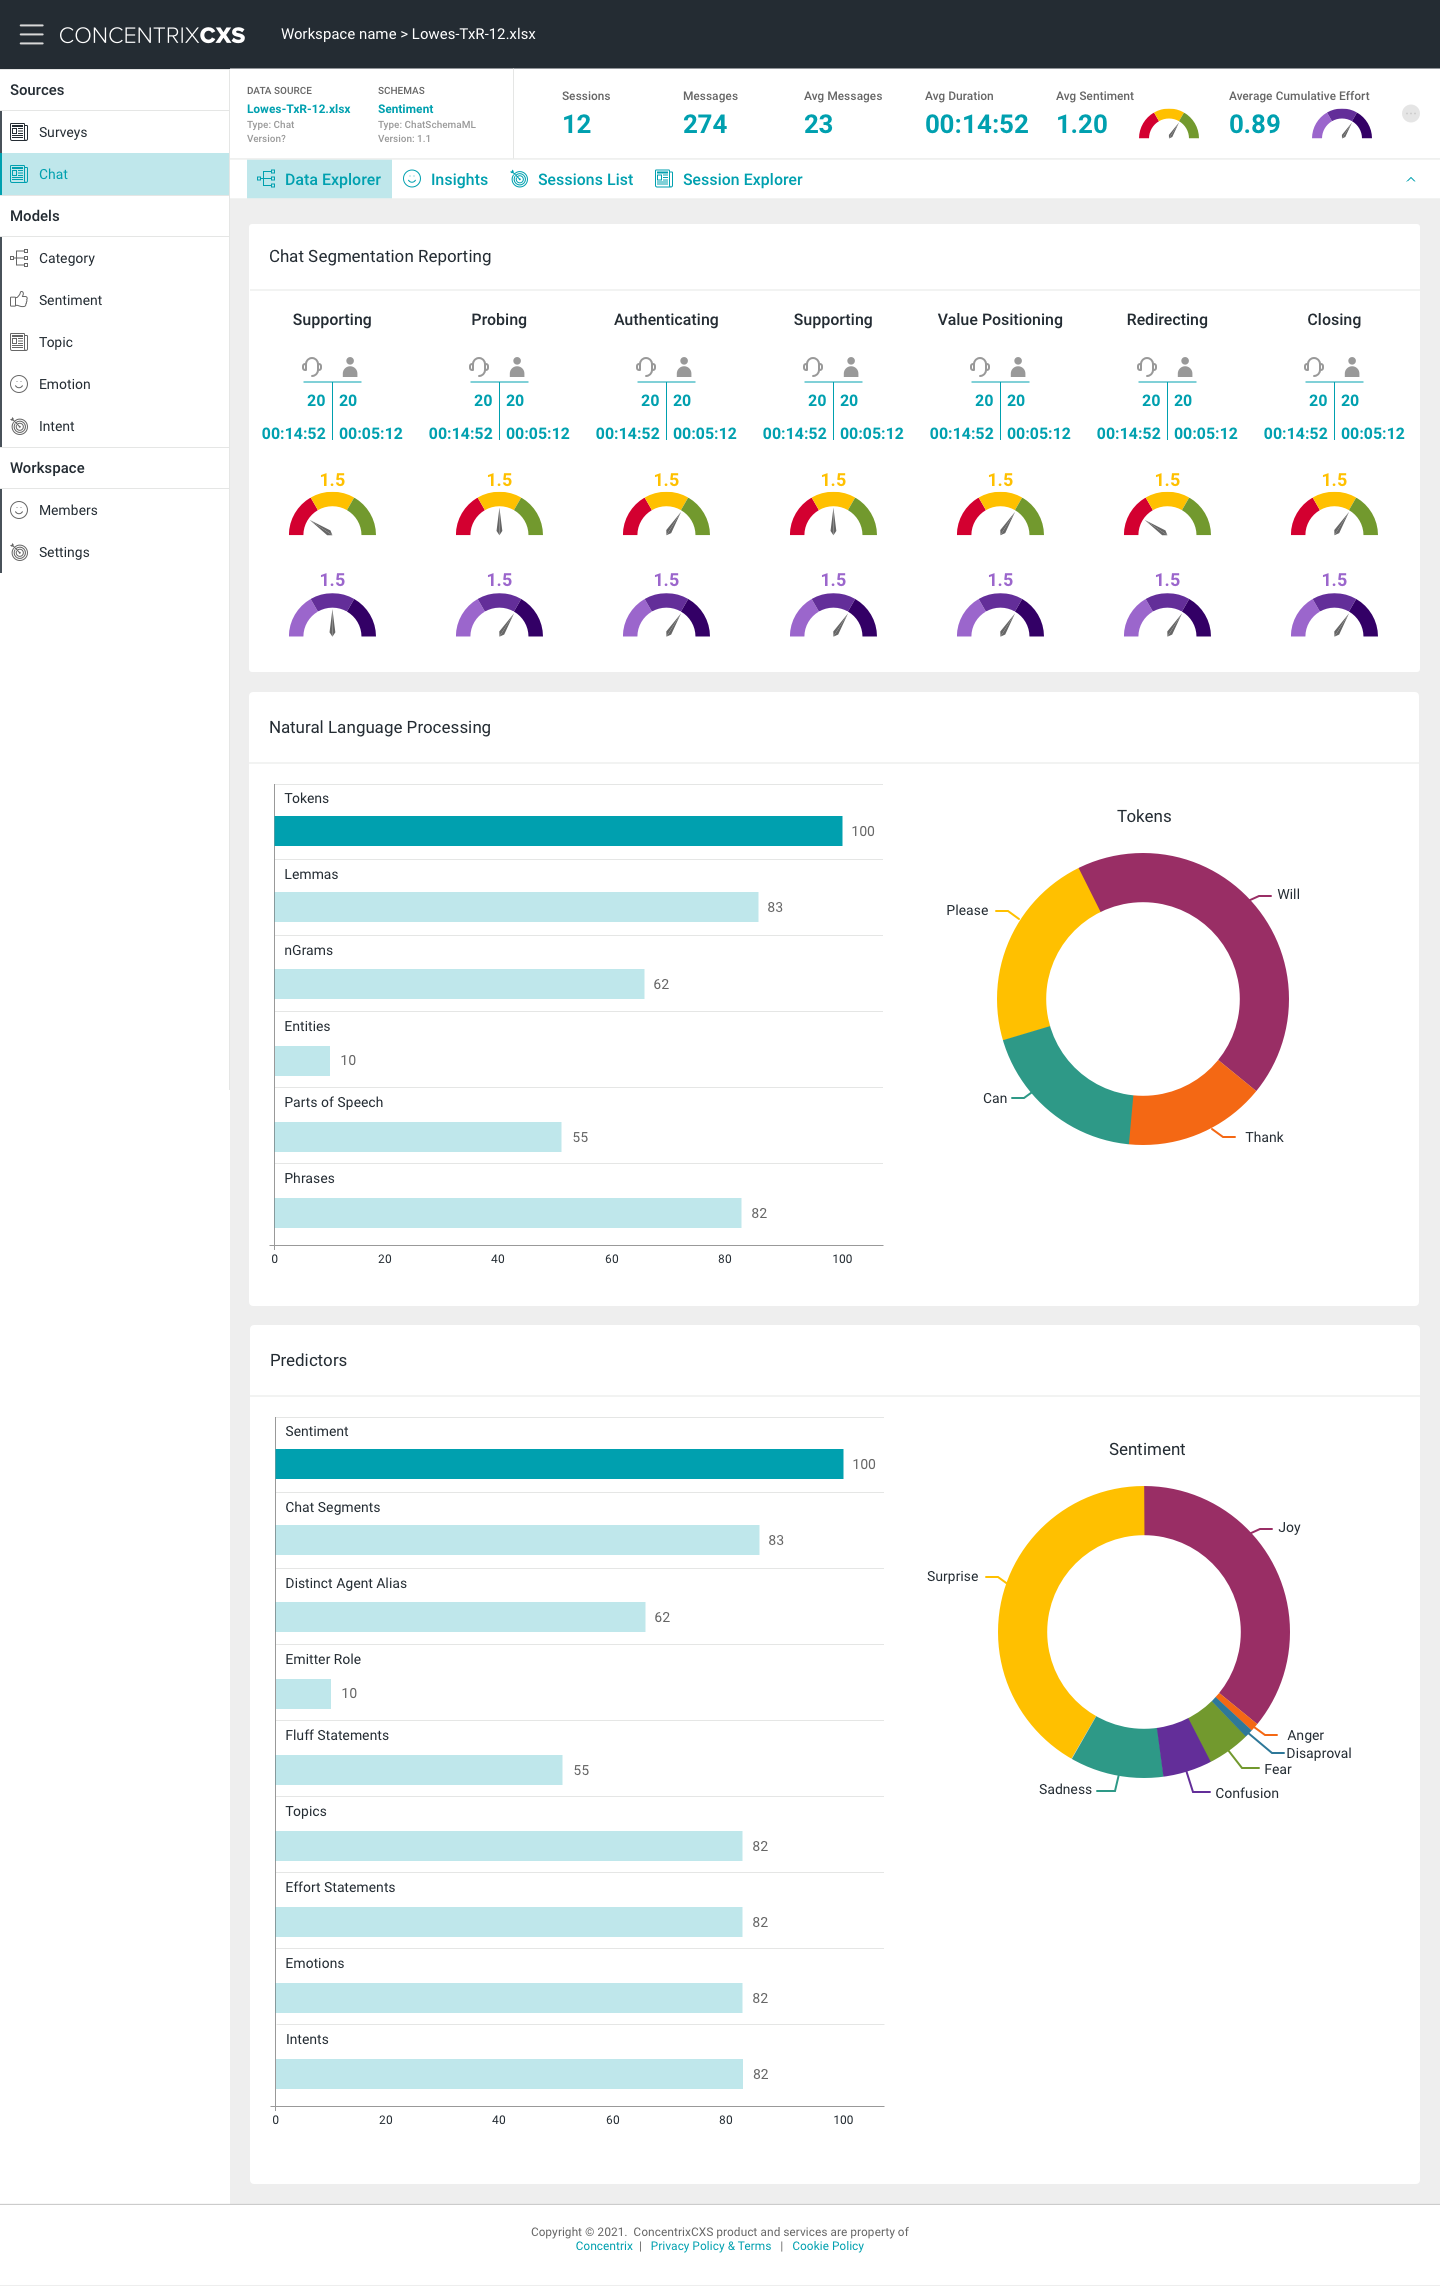
High Def
This is a high fidelity mockup for CXS data explorer. This design targets the analyst persona. They have the ability to dive deeply into specific parts of speech and gather insights.
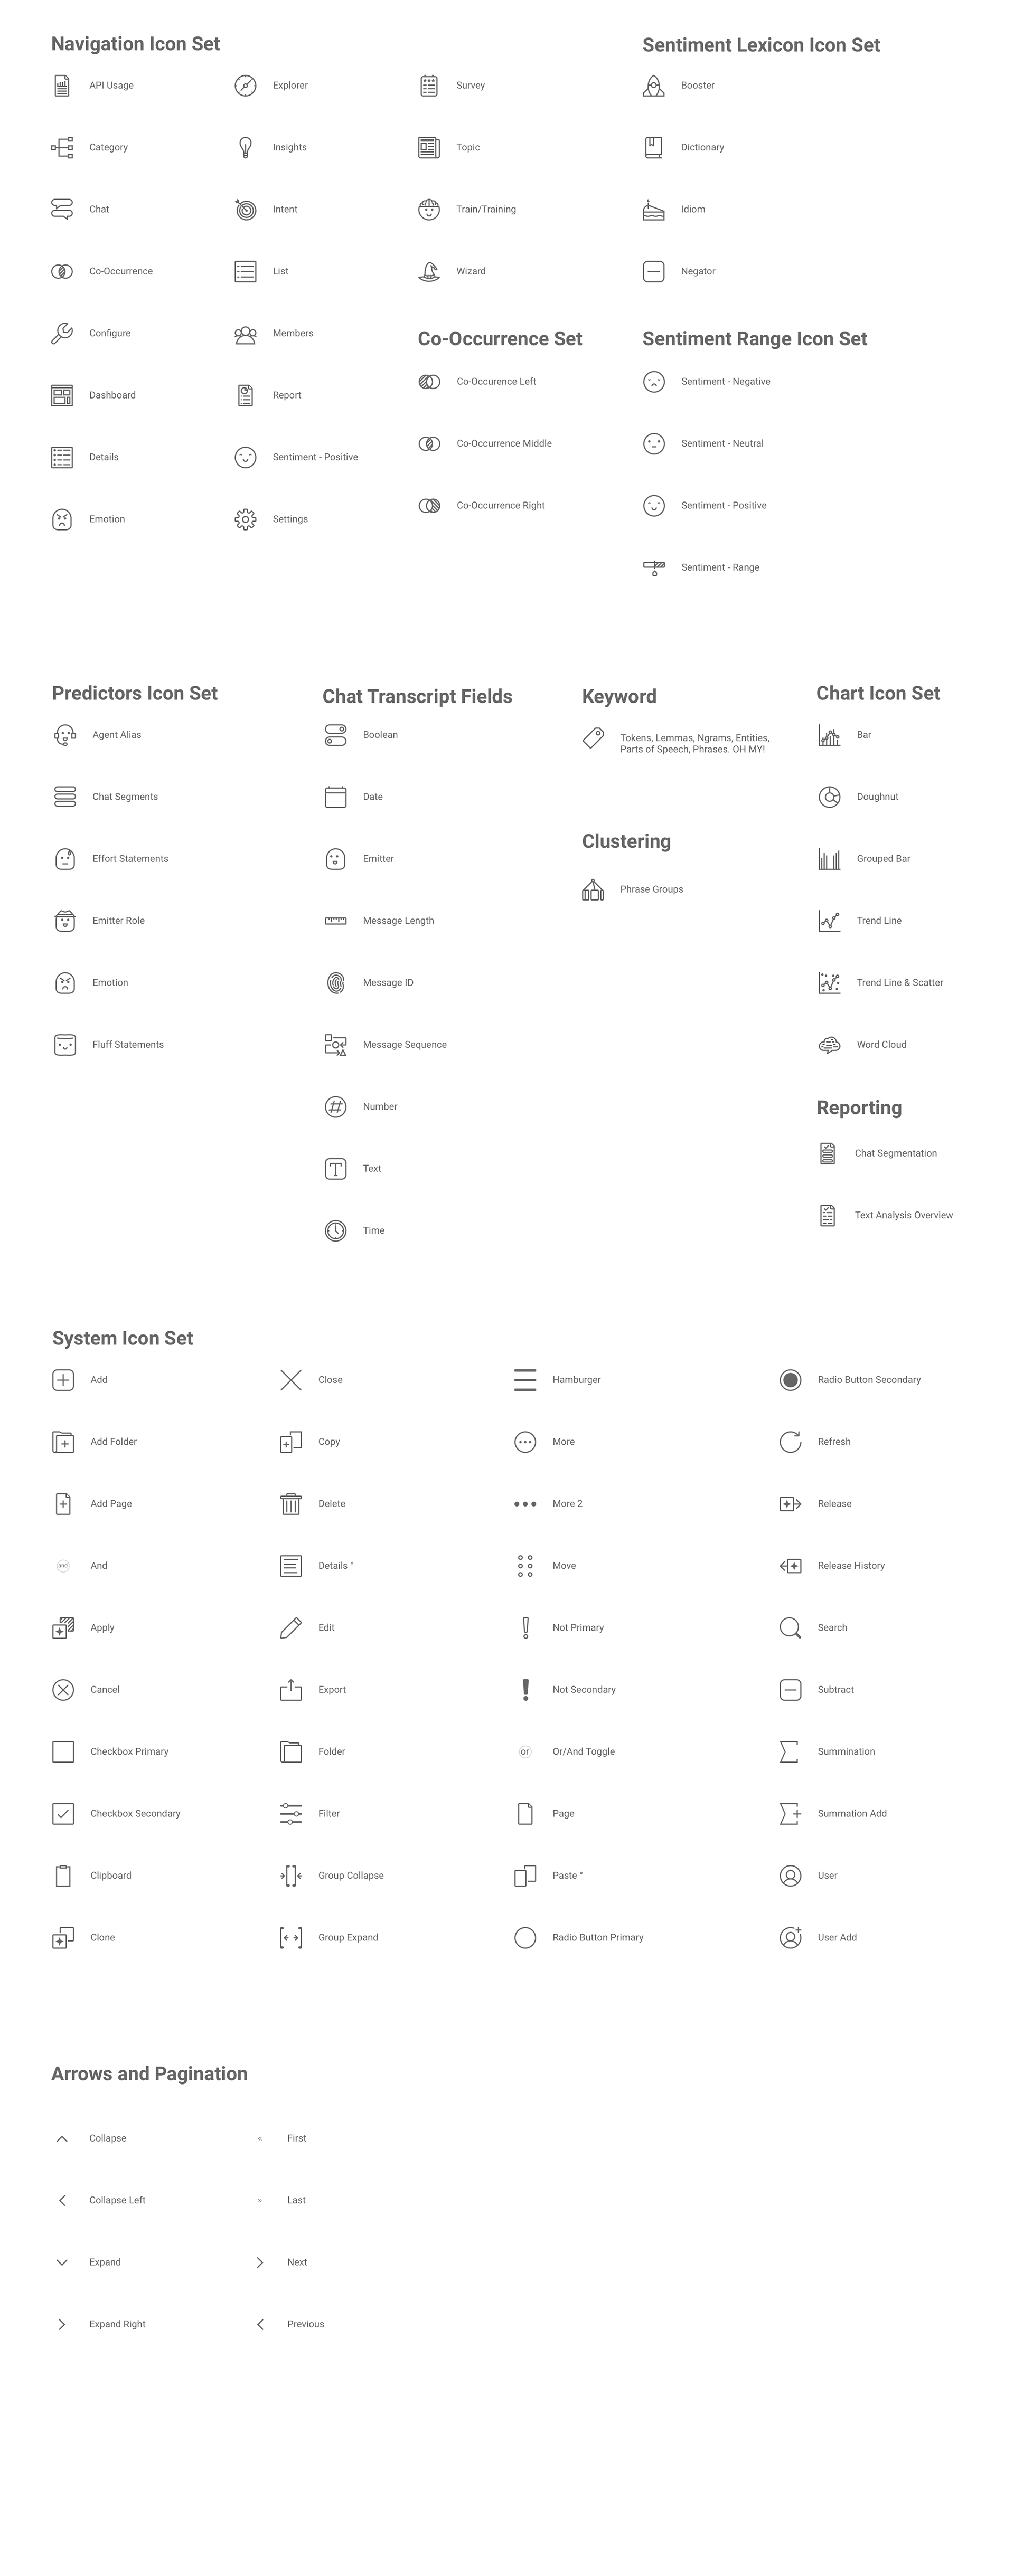
Custom Icon Pack
I love making icons and feel like this is a subtle way to customize and add personality. With CXS being very data heavy and created for analyst experts, I chose to keep the icons simple with clean lines but added a bit of humor with train, emotion, idiom (piece of cake), and emitter role.
Why This Project Mattered
The Concentrix CXS Machine Learning project transformed unstructured data into actionable insight. What began as a proof of concept became a powerful interface that helped analysts train, evaluate, and refine AI models without needing a data science background.
By visualizing confusion matrices, prediction accuracy, and category hierarchies, the tool made complex model behavior transparent and trustworthy. It bridged the gap between data science and design—turning technical outputs into intuitive, human-centered experiences.
Equally important, the project fostered deep collaboration between designers, engineers, and PhD data scientists. This cross-functional momentum not only improved the product but also boosted team morale, proving that innovation thrives where disciplines meet.